
Mathematics, 14.09.2021 06:20 gianna61
Create a frequency distribution, find the midpoint, relative frequency, cumulative frequency and create a histogram for the following:
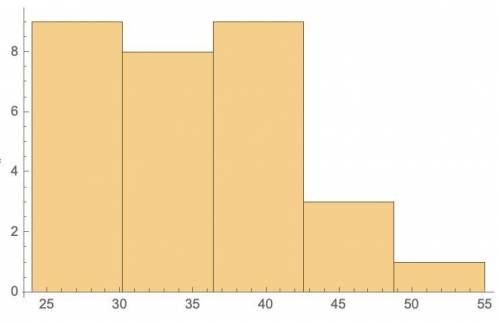
Data Set: Highway fuel consumptions (in miles per gallon) for a sample of cars
Number of Classes: 5 classes
32, 35, 28, 40, 30, 42, 55, 40, 45, 24, 28, 34, 40, 36, 34, 40, 30, 25, 28, 32, 40, 35, 25, 44, 26, 39, 38, 42, 45, 32

Answers: 3
Another question on Mathematics
Mathematics, 21.06.2019 15:00
How can you decide witch operations to use to slice a two step equation
Answers: 2
Mathematics, 21.06.2019 15:30
Click on the y intercept. -x +4 i know you cant click on it so could you just say the coordinates like (example - (1,0) you so much.
Answers: 2
Mathematics, 21.06.2019 16:00
Find the greatest common factor of the polynomial: 10x^5+15x^4-25x^3 10x^5 x^3 5x^3 5
Answers: 2
Mathematics, 21.06.2019 17:20
Consider the proof. given: segment ab is parallel to line de. prove: what is the missing statement in step 5?
Answers: 3
You know the right answer?
Create a frequency distribution, find the midpoint, relative frequency, cumulative frequency and cre...
Questions

Chemistry, 26.06.2019 23:30


Mathematics, 26.06.2019 23:30

English, 26.06.2019 23:30
Mathematics, 26.06.2019 23:30

Mathematics, 26.06.2019 23:30

Mathematics, 26.06.2019 23:30
Mathematics, 26.06.2019 23:30

Computers and Technology, 26.06.2019 23:30


