Some of the sub-questions have been answered. I will provide explanation to the already answered questions and then answer the unanswered parts
1. The graph type
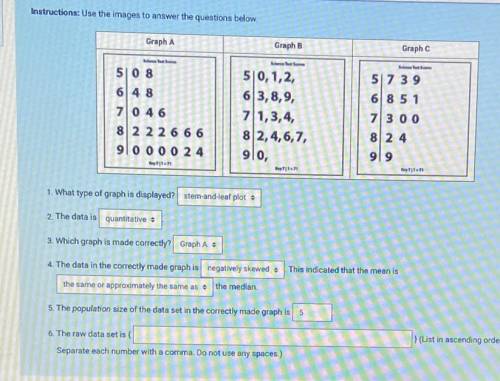
The three graph displayed are stem-and-leaf plots. The single numbers at the left-hand side are referred to as the stem, while the numbers at the right are called leaves.
2. The type of data
The three graphs display numerical data (i.e. numbers). Hence, the data are quantitative
3. The correct graph
To know the correct graph; the leaves on each line must be in ascending order and the delimiter to use is a blank space.
Only graph A obey the above illustration
4. Skewness
In graph A, the length of the leaves increases as we move from one stem to the other. This means that the graph is negatively skewed.
For a negative skewed stem plot, the mean is less than the median
5. The population size
This means that we count the number of leaves in the stem plot
The leaves are:

So, the population size is: 19
6. The data set
To do this, we include the stem to the corresponding leaves.
So, we have:

Learn more about stem and leaf plots at: