
Mathematics, 21.07.2021 21:40 PSAP17
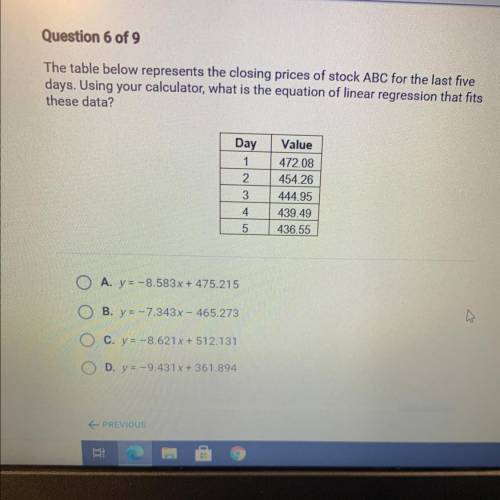
The table below represents the closing prices of stock ABC for the last five
days. Using your calculator, what is the equation of linear regression that fits
these data?
Day
1
2
3
Value
472.08
454.26
444.95
439.49
436.55
4
5
O
A. y = -8.583x + 475.215
B. y = -7.343x - 465.273
c. y = -8.621x + 512.131
D. Y = -9.431x + 361.894

Answers: 2
Another question on Mathematics
Mathematics, 21.06.2019 21:00
Solve this problem! extra ! 3025/5.5 = a/90.75 / = fraction
Answers: 3
Mathematics, 22.06.2019 01:40
The graph below shows the line of best fit for data collected on the number of cell phones in cell phone cases sold at the local electronic store on four different days
Answers: 3
Mathematics, 22.06.2019 02:30
Jennifer is 20 miles north of her house, and she is driving north on the highway at a rate of 55 miles per hour whats the slpoe
Answers: 2
You know the right answer?
The table below represents the closing prices of stock ABC for the last five
days. Using your calcu...
Questions

Mathematics, 25.08.2019 12:10

Social Studies, 25.08.2019 12:10
Mathematics, 25.08.2019 12:10


Business, 25.08.2019 12:10
Social Studies, 25.08.2019 12:10

Business, 25.08.2019 12:10

History, 25.08.2019 12:10
History, 25.08.2019 12:10


Health, 25.08.2019 12:10


