
Mathematics, 15.07.2021 19:20 madisonsimmons1120
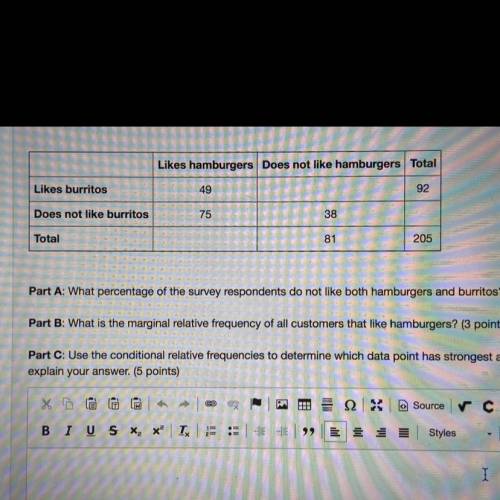
A food truck did a daily survey of customers to find their food preferences. The data is partially entered in the frequency table. Complete the table to
analyze the data and answer the questions:
Likes hamburgers Does not like hamburgers Total
Likes burritos
49
92
Does not like burritos
75
38
Total
81
205
Part A: What percentage of the survey respondents do not like both hamburgers and burritos? (2 points)
Part B: What is the marginal relative frequency of all customers that like hamburgers? (3 points)
Part C: Use the conditional relative frequencies to determine which data point has strongest association of its two factors. Use complete sentences to
explain your answer. (5 points)

Answers: 2


Another question on Mathematics
Mathematics, 21.06.2019 13:20
Use the elimination method to find the solution to the system of equations. 2x - 3y = -9 -x + 3y = 6
Answers: 1
Mathematics, 21.06.2019 16:00
5× 1/2 = ? a) more than 5 because you are multiplying by a whole number b) 5/10 because you multiply the numerator and denominator by 5 c) less than 5 because you are multiplying by a number that is more than 1 d) less than 5 because you are multiplying by a number that is less than 1
Answers: 3
Mathematics, 21.06.2019 18:30
Create a data set with 8 points in it that has a mean of approximately 10 and a standard deviation of approximately 1.
Answers: 1
Mathematics, 21.06.2019 18:30
What is coefficient of the term of degree of degree 5 in the polynomial below
Answers: 1
You know the right answer?
A food truck did a daily survey of customers to find their food preferences. The data is partially e...
Questions


Spanish, 22.08.2019 01:00

Social Studies, 22.08.2019 01:00
Social Studies, 22.08.2019 01:00

Mathematics, 22.08.2019 01:00


History, 22.08.2019 01:00
English, 22.08.2019 01:00


