
Mathematics, 08.07.2021 21:30 oliviaboils
Analyzing the Data:
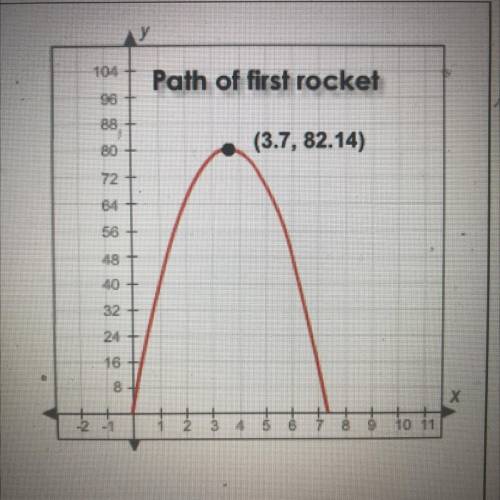
Suppose that the path of the first model rocket follows the equation
h(t)= -6 * (t - 3.7)^2 + 82.14,
Where t is the time in seconds (after the first rocket is launched), and h(t) is the height of each rocket, in feet.
3. Compare the equation with the graph of the function. Assume this graph is a transformation from f(t)= -6t^2. What does the term -3.7 do to the rocket’s graph? What does the value t= 3.7 represent in the science project? (What happens to the rocket?)
4. Again assuming a transformation from f(t)= -6t^2, what does the term 82.14 do to the rocket’s graph? What does the value h(t)= 82.14 represent in the science project? (What is happening to the rocket?)
5. Serena and Jack launch the second rocket 3 seconds after the first one. How is the graph of the second rocket different from the graph of the first rocket? Describe in terms of the vertical and horizontal shift.
6. What is the equation of the second rocket?
7. They launch the third rocket 3 seconds after the second rocket and from a 20-foot-tall platform. What will the graph of the third rocket look like? Describe in terms of vertical and horizontal shift.
8. What is the equation of the third rocket?

Answers: 3
Another question on Mathematics
Mathematics, 21.06.2019 18:40
That table shows measurements (in invhes$ from cubes with different side lengths. which pairs of variables have a linear relationship? check all that apply
Answers: 3
You know the right answer?
Analyzing the Data:
Suppose that the path of the first model rocket follows the equation
Questions
Mathematics, 19.12.2019 04:31
Mathematics, 19.12.2019 04:31


Biology, 19.12.2019 04:31
History, 19.12.2019 04:31
Mathematics, 19.12.2019 04:31
Mathematics, 19.12.2019 04:31


Law, 19.12.2019 04:31

Spanish, 19.12.2019 04:31
Mathematics, 19.12.2019 04:31

Mathematics, 19.12.2019 04:31
History, 19.12.2019 04:31

Advanced Placement (AP), 19.12.2019 04:31


