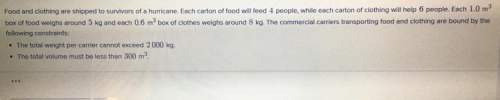
Which graph represents the solution set of the inequality x+ 22 6?
03---
-9 -8 -7 -6 -5 -4 -3...

Mathematics, 24.06.2021 23:50 mikk33
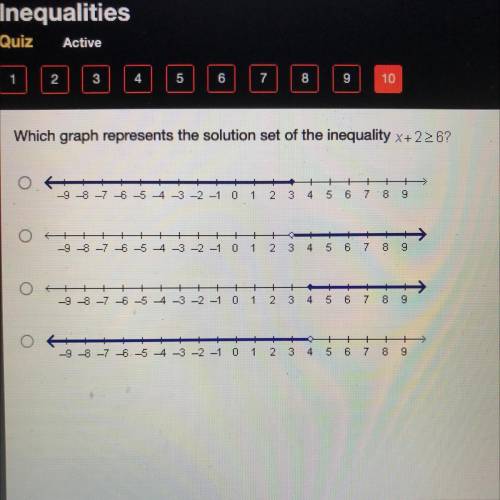
Which graph represents the solution set of the inequality x+ 22 6?
03---
-9 -8 -7 -6 -5 -4 -3 -2 -1 0 1 2 3 4 5 6 7 8 9
-9 -8 -7 -6 -5 4 -3 -2 -1 0 1 2 3 4 5 6 7 8 9
O +
-9-8-7 -6 -5 4 -3 -2 -1 0 1 2 3 4 5 6 7 8 9
OA 一
-9 -8 -7 -6 -5 4 -3 -2 -1 0 1 2 3 4 5 6 7 8 9

Answers: 2
Another question on Mathematics
Mathematics, 21.06.2019 16:00
You eat 8 strawberries and your friend eats 12 strawberries from a bowl. there are 20 strawberries left. which equation and solution give the original number of strawberries?
Answers: 1
Mathematics, 21.06.2019 16:30
Jorge planted flowers in his garden he planted one row of 12 tulips and one row of 36 daisies george's friend kylie has a garden with 75 flowers in it kylie's garden only contains tulips and daisies. is it possible for kylie‘s garden she have the same ratio of tulips to daisies as george's garden?
Answers: 1
Mathematics, 21.06.2019 17:00
Find dy/dx using implicit differentiation ln(20+e^xy)=y
Answers: 3
Mathematics, 21.06.2019 17:10
The frequency table shows a set of data collected by a doctor for adult patients who were diagnosed with a strain of influenza. patients with influenza age range number of sick patients 25 to 29 30 to 34 35 to 39 40 to 45 which dot plot could represent the same data as the frequency table? patients with flu
Answers: 2
You know the right answer?
Questions


English, 29.01.2020 14:58
Mathematics, 29.01.2020 14:58

Chemistry, 29.01.2020 14:58

Social Studies, 29.01.2020 14:58
Social Studies, 29.01.2020 14:58
English, 29.01.2020 14:58

Mathematics, 29.01.2020 14:58
Mathematics, 29.01.2020 14:58
History, 29.01.2020 14:58
Mathematics, 29.01.2020 14:58
History, 29.01.2020 14:58


