
Mathematics, 18.06.2021 07:20 cece4649
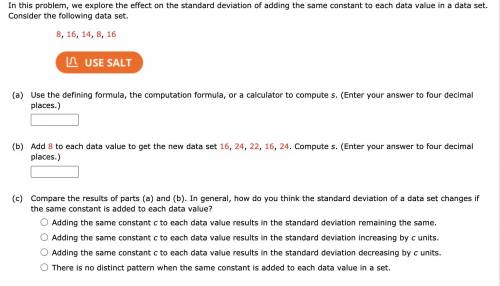
In this problem, we explore the effect on the standard deviation of adding the same constant to each data value in a data set. Consider the following data set.
8, 16, 14, 8, 16
A) Use the defining formula, the computation formula, or a calculator to compute s. (Enter your answer to four decimal places.)
B) Add 8 to each data value to get the new data set 16, 24, 22, 16, 24. Compute s. (Enter your answer to four decimal places.)
C) Compare the results of parts (a) and (b). In general, how do you think the standard deviation of a data set changes if the same constant is added to each data value?
Adding the same constant c to each data value results in the standard deviation remaining the same.
Adding the same constant c to each data value results in the standard deviation increasing by c units.
Adding the same constant c to each data value results in the standard deviation decreasing by c units.
There is no distinct pattern when the same constant is added to each data value in a set.

Answers: 1
Another question on Mathematics
Mathematics, 21.06.2019 18:00
Galen sold tickets of his church’s carnival for a total of $2,820. children’s tickets cost $3 each and adult tickets cost $5 each. the number of children’s tickets sold was 30 more than 3 times the number of adult tickets slod. how many children’s ticket and how many adult tickets did he sell?
Answers: 2
Mathematics, 21.06.2019 19:00
You earn a 12% commission for every car you sell. how much is your commission if you sell a $23,000 car?
Answers: 1
Mathematics, 21.06.2019 21:00
Atriangular field has sides of lengths 21, 39, and 41 yd. find the largest angle. (round your answer to the nearest degree.)
Answers: 1
Mathematics, 22.06.2019 02:20
There are two major tests of readiness for college: the act and the sat. act scores are reported on a scale from 1 to 36. the distribution of act scores in recent years has been roughly normal with mean µ = 20.9 and standard deviation s = 4.8. sat scores are reported on a scale from 400 to 1600. sat scores have been roughly normal with mean µ = 1026 and standard deviation s = 209. reports on a student's act or sat usually give the percentile as well as the actual score. the percentile is just the cumulative proportion stated as a percent: the percent of all scores that were lower than this one. tanya scores 1260 on the sat. what is her percentile (± 1)?
Answers: 1
You know the right answer?
In this problem, we explore the effect on the standard deviation of adding the same constant to each...
Questions


Chemistry, 29.09.2021 01:00
Mathematics, 29.09.2021 01:00

Arts, 29.09.2021 01:00
Mathematics, 29.09.2021 01:00

Computers and Technology, 29.09.2021 01:00


Mathematics, 29.09.2021 01:00
History, 29.09.2021 01:00
Mathematics, 29.09.2021 01:00
Mathematics, 29.09.2021 01:00


