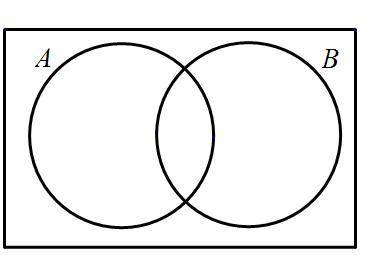
Choose the situation that is least accurately represented by the Venn diagram above.
A.
A is...

Mathematics, 10.06.2021 05:30 ritasolomon85
Choose the situation that is least accurately represented by the Venn diagram above.
A.
A is students at Virtual High School, and B is students who are employed.
B.
A is students at Virtual High School, and B is teachers at Virtual High School.
C.
A is people who work in New York City, and B is people who live in New York City.
D.
A is citizens of the United States, and B is students at a community college.

Answers: 3
Another question on Mathematics
Mathematics, 21.06.2019 22:10
Ellen makes and sells bookmarks. she graphs the number of bookmarks sold compared to the total money earned. why is the rate of change for the function graphed to the left?
Answers: 1
Mathematics, 21.06.2019 23:00
Calculate the average rate of change over the interval [1, 3] for the following function. f(x)=4(5)^x a. -260 b. 260 c. 240 d. -240
Answers: 1
You know the right answer?
Questions


Computers and Technology, 25.10.2019 18:43

Biology, 25.10.2019 18:43

Biology, 25.10.2019 18:43
Biology, 25.10.2019 18:43


