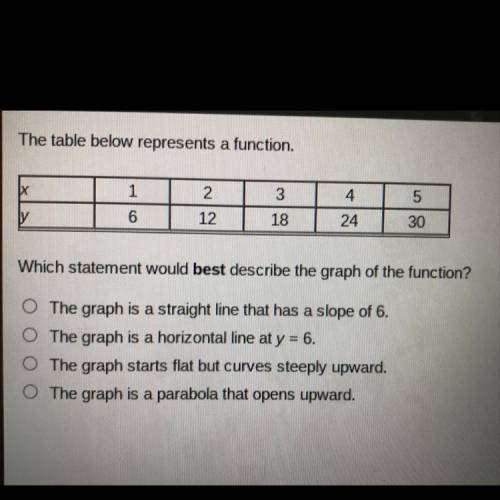
The table below represents a function.
x
1
2
3
4
5
y
6
12
18
24
30
Which statement would best describe the graph of the function?
The graph is a straight line that has a slope of 6.
The graph is a horizontal line at y = 6.
The graph starts flat but curves steeply upward.
The graph is a parabola that opens upward.