
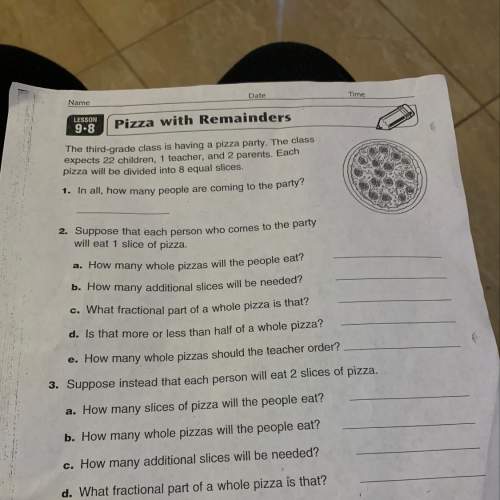
Mathematics, 08.06.2021 20:30 jawontestephens
A health food store has launched a new pack of vitamins for children. The store records the number of packs ordered by a random sample of 100 online customers and the number of packs ordered by a random sample of 100 walk-in customers. Two dot plots are shown one below the other. The title for the top dot plot is Online Customers and the title for the bottom plot is Walk In Customers. Below the line for each dot plot is written Number of Packs. There are markings from 2 to 6 on each line at intervals of one. For the top line there are 0, 0, 1, 4, 5 dots respectively for marks from 2 to 6. For the bottom line there are 6, 3, 1, 0, 0 dots respectively for marks from 2 to 6. On the right side, towards the middle of the two plots is shown a dot symbol equal to 10 customers. Which of the following inferences can be drawn about the buying pattern of the online customers versus that of the walk-in customers? Online customers buy an average of five packs compared with walk-in customers, who buy an average of two packs. Online customers buy an average of six packs compared with walk-in customers, who buy an average of three packs. Online customers buy an average of five packs compared with walk-in customers, who buy an average of three packs. Online customers buy an average of six packs compared with walk-in customers, who buy an average of two packs.

Answers: 3
Another question on Mathematics
Mathematics, 21.06.2019 15:30
The length of each stair is 11 inches. what is the rise, r, for each stair? round to the nearest inch. 2 inches 7 inches 17 inches 24 inches
Answers: 3
Mathematics, 21.06.2019 16:00
Choose the correct slope of the line that passes through the points (1, -3) and (3, -5)
Answers: 3
Mathematics, 21.06.2019 18:30
Deshawn uses 3/4 of a box of rice to cook dinner the portion he uses weighs 12 ounces right and solve an equation to find the weight of the full box of rice
Answers: 1
Mathematics, 21.06.2019 23:00
Which of the following graphs could represent a cubic function?
Answers: 1
You know the right answer?
A health food store has launched a new pack of vitamins for children. The store records the number o...
Questions

Biology, 21.08.2019 14:10
Biology, 21.08.2019 14:10

English, 21.08.2019 14:10

History, 21.08.2019 14:10

Social Studies, 21.08.2019 14:10
English, 21.08.2019 14:10

Mathematics, 21.08.2019 14:10

Mathematics, 21.08.2019 14:10
Biology, 21.08.2019 14:10
Mathematics, 21.08.2019 14:10


