the length of o'p' is  .
.
step-by-step explanation:
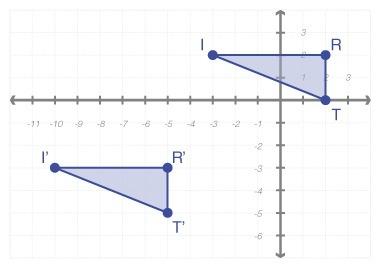
it is given that the quadrilateral m'n'o'p' is the image of quadrilateral mnop after dilation.
the center of dilation is origin and the scale factor is 1.5.
in dilation the image and preimge are similar figures. it means the sides of image and preimage are proportional.
the scale factor is defined as

the scale factor is 1.5.

multiply both sides by op.

note: if the value of op is given, then multiply the value of op with 1.5 to get the length of side o'p'.
therefore length of o'p' is .