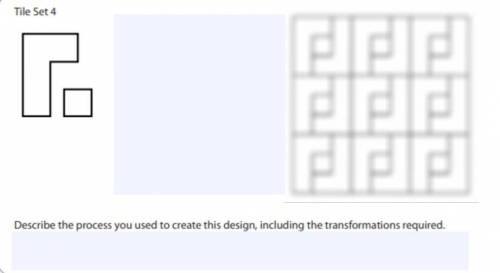
Describe the process you used to create this design, including the transformations required.
...

Mathematics, 27.05.2021 14:00 pinkpearl2022
Describe the process you used to create this design, including the transformations required.

Answers: 2
Another question on Mathematics
Mathematics, 21.06.2019 16:30
Scale factor of 2 is used to enlarge a figure as shown below the area of is 18 in.²
Answers: 3
Mathematics, 21.06.2019 20:30
Erin bought christmas cards for $2 each to send to her family and friends. which variable is the dependent variable?
Answers: 1
Mathematics, 22.06.2019 01:30
Acell phone company offers two plans to its subscribers. at the time new subscribers sign up, they are asked to provide some demographic information. the mean yearly income for a sample of 40 subscribers to plan a is $45,000 with a standard deviation of $9,200. for a sample of 25 subscribers to plan b, the mean income is $64,300 with a standard deviation of $7,100. at the 0.025 significance level, is it reasonable to conclude the mean income of those selecting plan b is larger? assume unequal population standard deviations. hint: for the calculations, assume the plan a as the first sample. what is the decision rule? (negative amount should be indicated by a minus sign. round your answer to 3 decimal places.) compute the value of the test statistic. (negative amount should be indicated by a minus sign. round your answer to 2 decimal places.) what is your decision regarding h0 ? reject h0 fail to reject h0 compute the p-value. less than 0.01 between 0.01 and 0.025 between 0.025 and 0.05 between 0.05 and 0.10 greater than 0.10
Answers: 3
Mathematics, 22.06.2019 04:10
You are in charge of the customer service phone line with many employees. at the end of each phone callthe customers are asked to rate their service from 1 to 5 stars, with 5 being the best. you find the averagerating for 20 randomly selected employees and decide you want to improve the ratings so you require thoseemployees to go through a new training program. you then wait a week and find the new average rating foreach employee. the average change is an increase in 1.3 stars with a standard devation of .9 stars.(a) is this data paired or not paired? (b) what are the null and alternative hypothesis being tested? (c) what is the t-statistic you would use? write the general formula and the final calculation.(d) sketch a t-distribution, label your t-statistic and the probability you would be interested in:
Answers: 2
You know the right answer?
Questions


History, 29.03.2020 02:59
History, 29.03.2020 02:59


Mathematics, 29.03.2020 03:00

World Languages, 29.03.2020 03:00
History, 29.03.2020 03:00
History, 29.03.2020 03:00
Social Studies, 29.03.2020 03:00
History, 29.03.2020 03:00


