
Mathematics, 25.05.2021 19:40 softball2895
In the small town of Middleton, there are only two restaurants that serve pizza- a small family owned Italian restaurant and a new franchise pizza restaurant. In a recent review of the franchise, a food critic reported that the pizza was delicious as promised. The only negative review that the franchise received from the critic was in reference to the inaccurate delivery time quoted during the online order process. In response to the article, the franchise owner used a program to analyze the online pizza orders that took place during the week before the review. He chose to track the orders at 6pm each day. He recorded his results in the frequency table below.
Monday Tuesday Wednesday Thursday Friday
On Time ||| ||
Late | |||
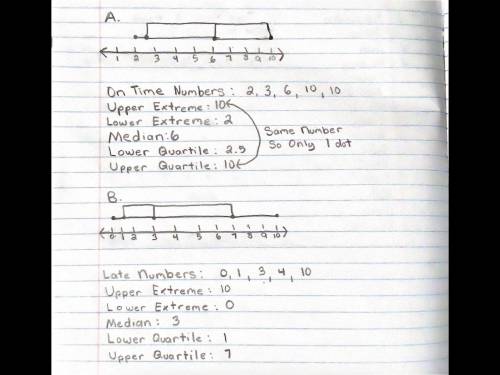
Use the frequency table to create a box and whisker plot of the On Time data values. In your final answer, include all calculations necessary to create the box and whisker plot.
Use the frequency table to create a box and whisker plot of the Late data values. In your final answer, include all calculations necessary to create the box and whisker plot.

Answers: 3
Another question on Mathematics
Mathematics, 21.06.2019 21:30
Create a graph for the demand for starfish using the following data table: quantity/price of starfish quantity (x axis) of starfish in dozens price (y axis) of starfish per dozen 0 8 2 6 3 5 5 2 7 1 9 0 is the relationship between the price of starfish and the quantity demanded inverse or direct? why? how many dozens of starfish are demanded at a price of five? calculate the slope of the line between the prices of 6 (quantity of 2) and 1 (quantity of 7) per dozen. describe the line when there is a direct relationship between price and quantity.
Answers: 3
Mathematics, 21.06.2019 21:30
Name and describe the three most important measures of central tendency. choose the correct answer below. a. the mean, sample size, and mode are the most important measures of central tendency. the mean of a data set is the sum of the observations divided by the middle value in its ordered list. the sample size of a data set is the number of observations. the mode of a data set is its highest value in its ordered list. b. the sample size, median, and mode are the most important measures of central tendency. the sample size of a data set is the difference between the highest value and lowest value in its ordered list. the median of a data set is its most frequently occurring value. the mode of a data set is sum of the observations divided by the number of observations. c. the mean, median, and mode are the most important measures of central tendency. the mean of a data set is the product of the observations divided by the number of observations. the median of a data set is the lowest value in its ordered list. the mode of a data set is its least frequently occurring value. d. the mean, median, and mode are the most important measures of central tendency. the mean of a data set is its arithmetic average. the median of a data set is the middle value in its ordered list. the mode of a data set is its most frequently occurring value.
Answers: 3
Mathematics, 21.06.2019 23:00
Jane’s favorite fruit punch consists of pear, pineapple, and plum juices in the ratio 5: 2: 3. chapter reference how much punch can she make if she has only 6 cups of plum juice?
Answers: 1
Mathematics, 22.06.2019 00:00
Heather is a cashier. she can ring up 1212 customers in 99 minutes. at this rate, how many minutes does it take her to ring up 44 customers?
Answers: 1
You know the right answer?
In the small town of Middleton, there are only two restaurants that serve pizza- a small family owne...
Questions

History, 02.12.2019 18:31

History, 02.12.2019 18:31

Physics, 02.12.2019 18:31
Mathematics, 02.12.2019 18:31

Social Studies, 02.12.2019 18:31
Mathematics, 02.12.2019 18:31
Mathematics, 02.12.2019 18:31
Mathematics, 02.12.2019 18:31
History, 02.12.2019 18:31


