x = 17
step-by-step explanation:
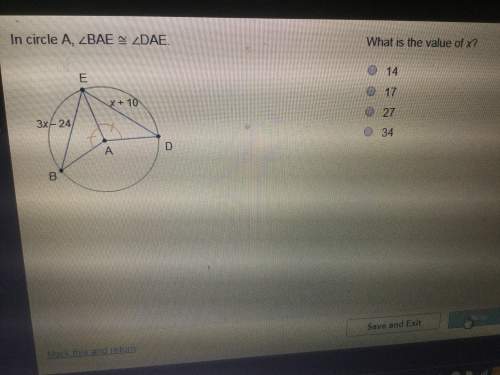
in the given figure, two triangles are inscribed in a circle where ∠bae ≅ ∠dae which makes the side be and de equal so we can write it as:
3x - 24 = x + 10
solving this equation for x to get:
3x - x = 10 + 24
2x = 34
x = 34/2
x = 17
therefore, the value of x = 17.