
Mathematics, 24.05.2021 20:30 zachthomas024
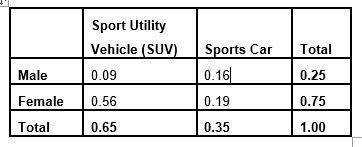
The following table shows the probability of females and males preferring to drive an SUV or a sports car.
(SUV) Sports Car Total
Male 0.09 0.16 0.25
Female 0.56 0.19 0.75
Total 0.65 0.35 1.00
(a) Are being male and preferring to drive a sports car independent or not independent? Show all calculations to support your answer. Round answer to the nearest hundredth. Be sure to answer the question.
Let A = being a male
Let B = preferring to drive a sports car
(b) Are being female and preferring to drive an SUV independent or not independent? Show all calculations to support your answer. Round answer to the nearest hundredth. Be sure to answer the question.
Let A = being a female
Let B = preferring to drive an SUV

Answers: 3
Another question on Mathematics
Mathematics, 21.06.2019 15:30
Which equation represents the line that passes through the points and (4, 10) and (2, 7)? y = 3/2x - 11y = 3/2x +4y = - 3/2x + 19y = - 3/2x + 16
Answers: 2
Mathematics, 21.06.2019 16:00
Given a circle with measures of (c, d, and r) and a circle with measures of (c', d', and r'), what is d if c c' = 12 and d' = 0.50? a) 3 b) 6 c) 12 d) 24
Answers: 2
Mathematics, 21.06.2019 18:30
Me complete this proof! prove that a quadrilateral is a square. me with the steps for this proof.
Answers: 1
You know the right answer?
The following table shows the probability of females and males preferring to drive an SUV or a sport...
Questions


Arts, 17.07.2019 12:30


Biology, 17.07.2019 12:30

Chemistry, 17.07.2019 12:30

Social Studies, 17.07.2019 12:30

English, 17.07.2019 12:30
English, 17.07.2019 12:30

Computers and Technology, 17.07.2019 12:30
Computers and Technology, 17.07.2019 12:30
Mathematics, 17.07.2019 12:30


Physics, 17.07.2019 12:30
Mathematics, 17.07.2019 12:30


