
Mathematics, 21.05.2021 02:40 gbprulesmile
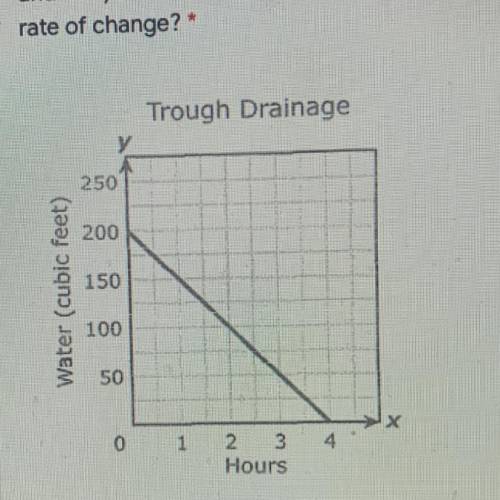
4. The graph below models the drainage. The x-axis is the time in hours,
and the y-axis is the cubic feet of water in the trough(pipe).
What is the
rate of change?"
a) -50
b) 50
c) -200
d) 200

Answers: 3
Another question on Mathematics
Mathematics, 21.06.2019 23:30
Xy x xy if a and b are positive integers such that a*b=9 and b*a=72 what is the value of a/b
Answers: 3
You know the right answer?
4. The graph below models the drainage. The x-axis is the time in hours,
and the y-axis is the cubi...
Questions

Mathematics, 06.07.2019 07:30


History, 06.07.2019 07:30
History, 06.07.2019 07:30
Mathematics, 06.07.2019 07:30
Mathematics, 06.07.2019 07:30

Health, 06.07.2019 07:30

History, 06.07.2019 07:30


