
Mathematics, 21.05.2021 02:00 shawntawright1
Don’t need help with the scatter plot really I just need help finding the Correlation coefficient
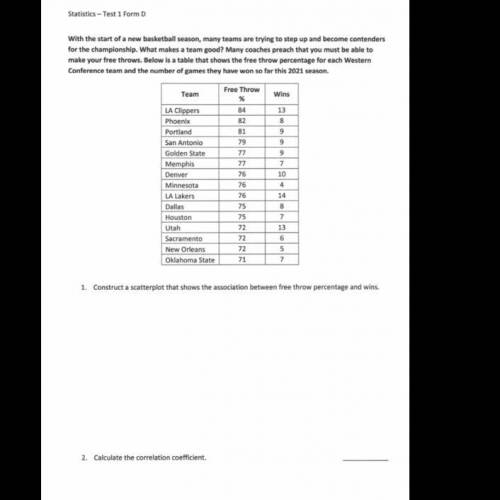
With the start of a new basketball season, many teams are trying to step up and become contenders
for the championship. What makes a team good? Many coaches preach that you must be able to
make your free throws. Below is a table that shows the free throw percentage for each Western
Conference team and the number of games they have won so far this 2021 season.
Wins
0
Team
LA Clippers
Phoenix
Portland
San Antonio
Golden State
Memphis
Denver
Minnesota
LA Lakers
Dallas
Houston
Utah
Sacramento
New Orleans
Oklahoma State
Free Throw
%
84
82
81
79
77
77
76
76
76
75
75
72
72
72
71
13
8
9
9
9
7
10
4
14
8
7
13
6
5
7
1. Construct a scatterplot that shows the association between free throw percentage and wins.
2. Calculate the correlation coefficient
I

Answers: 3
Another question on Mathematics
Mathematics, 21.06.2019 21:30
Rhombus adef is inscribed into a triangle abc so that they share angle a and the vertex e lies on the side bc . what is the length of the side of the rhombus if ab=c, and ac=b.
Answers: 1
Mathematics, 21.06.2019 23:30
Determine if the following statement is true or false. the normal curve is symmetric about its​ mean, mu. choose the best answer below. a. the statement is false. the normal curve is not symmetric about its​ mean, because the mean is the balancing point of the graph of the distribution. the median is the point where​ 50% of the area under the distribution is to the left and​ 50% to the right.​ therefore, the normal curve could only be symmetric about its​ median, not about its mean. b. the statement is true. the normal curve is a symmetric distribution with one​ peak, which means the​ mean, median, and mode are all equal.​ therefore, the normal curve is symmetric about the​ mean, mu. c. the statement is false. the mean is the balancing point for the graph of a​ distribution, and​ therefore, it is impossible for any distribution to be symmetric about the mean. d. the statement is true. the mean is the balancing point for the graph of a​ distribution, and​ therefore, all distributions are symmetric about the mean.
Answers: 2
Mathematics, 22.06.2019 00:00
At noon a tank contained 10cm water. after several hours it contained 7cm of water. what is the percent decrease of water in the tank?
Answers: 1
Mathematics, 22.06.2019 00:00
At a pizza shop 70% of the customers order a pizza 25% of the customers order a salad and 15% of the customers order both a pizza and a salad if s customer is chosen at random what is the probability that he or she orders either a pizza or a salad
Answers: 1
You know the right answer?
Don’t need help with the scatter plot really I just need help finding the Correlation coefficient
W...
Questions

History, 22.05.2020 04:05
History, 22.05.2020 04:05
Mathematics, 22.05.2020 04:05

Mathematics, 22.05.2020 04:05

English, 22.05.2020 04:05

Biology, 22.05.2020 04:05


