
Mathematics, 20.05.2021 22:30 Marcynandrew
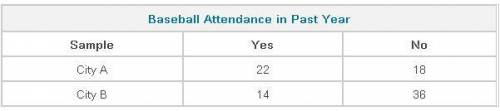
About 55 percent of people in the U. S. attend at least one baseball game each season. Mark surveys a random sample of people from two cities in Pennsylvania. Compare the samples with the national percentage.
City A: 82%
City B: 39%
The data suggests that the percentage of people who attend at least one game a season in City A is the greater than the national percentage, while the percentage of people who attend a game in City B is less than the national percentage.
City A: 12%
City B: 5%
The data suggests that the percentage of people who attend at least one game a season in City A and City B is less than the national percent.
City A: 55%
City B: 28%
The data suggests that the percentage of people who attend at least one game a season in City A is the same as the national percentage. The percent of people that attend a game in City B is less than the national percentage.
City A:122%
City B: 257%
The data suggests that the percentage of people who attend a game in City A and City B is greater than the national percentage.

Answers: 1
Another question on Mathematics
Mathematics, 21.06.2019 14:50
On a piece of paper, graph . then determine which answer choice matches the graph you drew
Answers: 1
Mathematics, 21.06.2019 16:30
The sales tax rate is 7.25%. how much tax in dollars is added on an item that costs $56.00? a. $4.06 b. $7.25 c. $14.50 d. $60.06
Answers: 2
Mathematics, 21.06.2019 22:00
After a dreary day of rain, the sun peeks through the clouds and a rainbow forms. you notice the rainbow is the shape of a parabola. the equation for this parabola is y = -x2 + 36. graph of a parabola opening down at the vertex 0 comma 36 crossing the x–axis at negative 6 comma 0 and 6 comma 0. in the distance, an airplane is taking off. as it ascends during take-off, it makes a slanted line that cuts through the rainbow at two points. create a table of at least four values for the function that includes two points of intersection between the airplane and the rainbow. analyze the two functions. answer the following reflection questions in complete sentences. what is the domain and range of the rainbow? explain what the domain and range represent. do all of the values make sense in this situation? why or why not? what are the x- and y-intercepts of the rainbow? explain what each intercept represents. is the linear function you created with your table positive or negative? explain. what are the solutions or solution to the system of equations created? explain what it or they represent. create your own piecewise function with at least two functions. explain, using complete sentences, the steps for graphing the function. graph the function by hand or using a graphing software of your choice (remember to submit the graph).
Answers: 2
Mathematics, 22.06.2019 01:10
"curse these trig-loving pirates! " devora mutters as she looks at the map. then, after thinking for a moment, she walks back to the entrance of the secret cave, measuring 48 meters along the way. after performing a calculation, devora walks back to the empty treasure, faces the entrance, and turns a certain number of degrees to her left before walking 89 meters to the treasure. supposing that the angle at the cave entrance is acute and that devora's calculations were correct, how many degrees did she turn?
Answers: 2
You know the right answer?
About 55 percent of people in the U. S. attend at least one baseball game each season. Mark surveys...
Questions


Mathematics, 24.12.2020 06:20

History, 24.12.2020 06:30
History, 24.12.2020 06:30

Social Studies, 24.12.2020 06:30
Mathematics, 24.12.2020 06:30

Chemistry, 24.12.2020 06:30

Mathematics, 24.12.2020 06:30
Mathematics, 24.12.2020 06:30
Health, 24.12.2020 06:30
Mathematics, 24.12.2020 06:30


