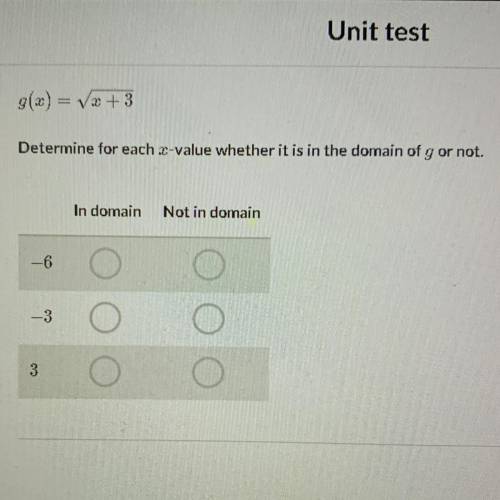
Determine for each x-value whether it is in the domain of g or not.
g(x) = sqrt (x+3)
-...

Mathematics, 19.05.2021 19:50 georgehall9515
Determine for each x-value whether it is in the domain of g or not.
g(x) = sqrt (x+3)
-6 =
-3 =
3 =

Answers: 2
Another question on Mathematics
Mathematics, 21.06.2019 21:40
The management of a supermarket wants to adopt a new promotional policy of giving a free gift to every customer who spends more than a certain amount per visit at this supermarket. the expectation of the management is that after this promotional policy is advertised, the expenditures for all customers at this supermarket will be normally distributed with a mean of $95 and a standard deviation of $20. if the management wants to give free gifts to at most 10% of the customers, what should the amount be above which a customer would receive a free gift?
Answers: 2
Mathematics, 21.06.2019 23:40
Solve these problems: 1.what is the perimeter of an equilateral triangle with sides measuring 6cm? 2. a regular pentagon has sides measuring 3.2 cm. what is its perimeter? 3. a regular decagon has sides of 3.5mm . what is it’s perimeter? 4. a regular octagon has a perimeter of 64cm. what is the length of one of the sides? 5. a regular hexagon has a perimeter of 72mm . what is the length of one of the sides? 6. what is the perimeter of a rhombus with sides measuring 11m?
Answers: 2
Mathematics, 22.06.2019 01:30
Arace is 10 kilometers long.markers will be placed at the beginning and end of the race course and at each 500 meter mark.how many markers are needed to mark the course for the race?
Answers: 3
Mathematics, 22.06.2019 02:30
Atrain traveled for 1.5 hours to the first station, stopped for 30 minutes, then traveled for 4 hours to the final station where it stopped for 1 hour. the total distance traveled is a function of time. which graph most accurately represents this scenario? a graph is shown with the x-axis labeled time (in hours) and the y-axis labeled total distance (in miles). the line begins at the origin and moves upward for 1.5 hours. the line then continues upward at a slow rate until 2 hours. from 2 to 6 hours, the line continues quickly upward. from 6 to 7 hours, it moves downward until it touches the x-axis a graph is shown with the axis labeled time (in hours) and the y axis labeled total distance (in miles). a line is shown beginning at the origin. the line moves upward until 1.5 hours, then is a horizontal line until 2 hours. the line moves quickly upward again until 6 hours, and then is horizontal until 7 hours a graph is shown with the axis labeled time (in hours) and the y-axis labeled total distance (in miles). the line begins at the y-axis where y equals 125. it is horizontal until 1.5 hours, then moves downward until 2 hours where it touches the x-axis. the line moves upward until 6 hours and then moves downward until 7 hours where it touches the x-axis a graph is shown with the axis labeled time (in hours) and the y-axis labeled total distance (in miles). the line begins at y equals 125 and is horizontal for 1.5 hours. the line moves downward until 2 hours, then back up until 5.5 hours. the line is horizontal from 5.5 to 7 hours
Answers: 1
You know the right answer?
Questions


Spanish, 28.08.2019 23:30
Mathematics, 28.08.2019 23:30
Biology, 28.08.2019 23:30

History, 28.08.2019 23:30
Mathematics, 28.08.2019 23:30
Spanish, 28.08.2019 23:30

Social Studies, 28.08.2019 23:30
History, 28.08.2019 23:30

Mathematics, 28.08.2019 23:30
Mathematics, 28.08.2019 23:30

Geography, 28.08.2019 23:30
History, 28.08.2019 23:30

Physics, 28.08.2019 23:30
Mathematics, 28.08.2019 23:30


