
Mathematics, 18.05.2021 15:50 mervindavisk
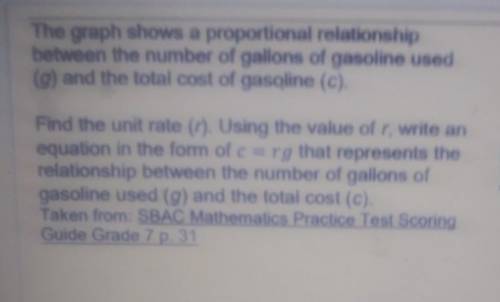
The graph shows a proportional relationship between the number of gallons of gasoline used (g) and the total cost of gasoline (c) Find the unit rate (r). Using the value of r, write an equation in the form ole that represents the relationship between the number of gallons of gasoline used (g) and the total cost (c). Taken from: SBAC Mathematics Practice Test Scoring Guide Grade 7 p. 31

Answers: 1
Another question on Mathematics
Mathematics, 21.06.2019 14:10
Apackage of bacon holds 15 strips of bacon. the pancake house uses 17 packages of bacon in the morning and 21 packages in the afternoon. how many more strips were used in the afternoon than the morning?
Answers: 1
Mathematics, 21.06.2019 19:30
You deposit $5000 each year into an account earning 3% interest compounded annually. how much will you have in the account in 30 years?
Answers: 3
Mathematics, 21.06.2019 19:30
The amount spent on food and drink by 20 customers is shown below what is the modal amount spent and the median amount spent? 40 25 8 36 18 15 24 27 43 9 12 19 22 34 31 20 26 19 17 28
Answers: 1
Mathematics, 21.06.2019 21:50
Determine the common ratio and find the next three terms of the geometric sequence. 10, 2, 0.4, a. 0.2; -0.4, -2, -10 c. 0.02; 0.08, 0.016, 0.0032 b. 0.02; -0.4, -2, -10 d. 0.2; 0.08, 0.016, 0.0032 select the best answer from the choices provided a b c d
Answers: 1
You know the right answer?
The graph shows a proportional relationship between the number of gallons of gasoline used (g) and t...
Questions
Mathematics, 16.04.2021 21:10

Chemistry, 16.04.2021 21:10

Mathematics, 16.04.2021 21:10

Biology, 16.04.2021 21:10
Mathematics, 16.04.2021 21:10

History, 16.04.2021 21:10
English, 16.04.2021 21:10

Social Studies, 16.04.2021 21:10

Physics, 16.04.2021 21:10
Biology, 16.04.2021 21:10
Mathematics, 16.04.2021 21:10
Mathematics, 16.04.2021 21:10
Mathematics, 16.04.2021 21:10


