
Mathematics, 17.05.2021 03:30 SL10355
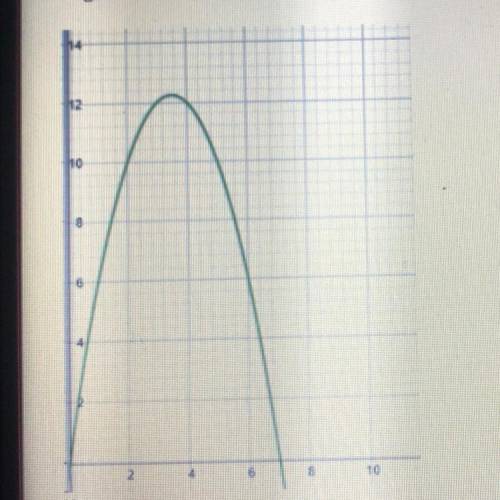
The following graph represents the hourly commission of a home appliance salesperson, Y, based on the number of
salespeople that are working the showroom floor, The graph of the hourly commission of the salesperson is a
quadratic function. What is the equation for the function in standard form if the vertex is (3.5, 12.25) and the
origin is the only other known point?

Answers: 3
Another question on Mathematics
Mathematics, 21.06.2019 15:30
Michelle had a birthday party. she bought a bag of candy with 96 starbursts, 72 hershey's, and 68 reese's. she wants to use all the candy she bought to make goody bags with the same amount of starbursts, hershey's and reese's in each bag. what is the largest number of bags she can make?
Answers: 1
Mathematics, 21.06.2019 16:20
Browning labs is testing a new growth inhibitor for a certain type of bacteria. the bacteria naturally grows exponentially each hour at a rate of 6.2%. the researchers know that the inhibitor will make the growth rate of the bacteria less than or equal to its natural growth rate. the sample currently contains 100 bacteria.the container holding the sample can hold only 300 bacteria, after which the sample will no longer grow. however, the researchers are increasing the size of the container at a constant rate allowing the container to hold 100 more bacteria each hour. they would like to determine the possible number of bacteria in the container over time.create a system of inequalities to model the situation above, and use it to determine how many of the solutions are viable.
Answers: 1
Mathematics, 21.06.2019 19:30
The first floor of marcus’ house is 1,440 square feet. he will cover 1,033 square feet with wood and the rest with tile. a box of tiles will cover 11 square feet. how many boxes of tile does marcus need to buy to cover the floor?
Answers: 1
Mathematics, 21.06.2019 20:00
Ialready asked this but i never got an answer. will give a high rating and perhaps brainliest. choose the linear inequality that describes the graph. the gray area represents the shaded region. y ≤ –4x – 2 y > –4x – 2 y ≥ –4x – 2 y < 4x – 2
Answers: 1
You know the right answer?
The following graph represents the hourly commission of a home appliance salesperson, Y, based on th...
Questions
Mathematics, 08.12.2020 01:10

Computers and Technology, 08.12.2020 01:10


Chemistry, 08.12.2020 01:10


Mathematics, 08.12.2020 01:10
Biology, 08.12.2020 01:10
History, 08.12.2020 01:10
Chemistry, 08.12.2020 01:10
Chemistry, 08.12.2020 01:10
Mathematics, 08.12.2020 01:10
Health, 08.12.2020 01:10
English, 08.12.2020 01:10


