
Mathematics, 13.05.2021 23:30 melanysanson11
1) The table shows the distances, in meters, that each player in a game tossed a ball, and the total number of earned points each player made for those tosses.
Distance (m)
6.5 6 5 8.5 2 5.5 6.5 8 3
6 4.5 6
Total earned points
15 15 22 21 9 8 14 14 19
27 14 16
(a) Create a scatter plot of the data set. Use the distance for the input variable and the total earned points for the output variable.
(b) Are there any clusters or outliers in the data set? If so, identify them.
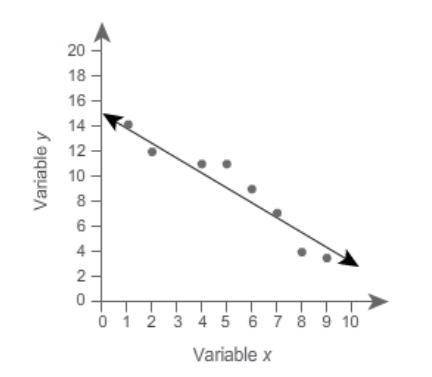
2) A linear model for the data in the table is shown in the scatter plot.
x: 1 2 4 5 6 7 8 9
y: 14 12 11 11 9 7 4 3.5
(PICTURE INCLUDED)
(c) Which two points should you use to find the equation of the model? Explain.
(d) Use the two points you chose in Part (a) to find the slope of the linear model, rounded to three decimal places. Show your work.
(e) What is the equation of the linear model in point-slope form?
(f) Rearrange the equation you wrote in Part (c) into slope-intercept form. Show your work.
(3) The data set shows the number of practice throws players in a basketball competition made and the number of free throws they made in a timed competition.
Practice throws
4 10 6 15 0 7 11
Free throws
8 23 9 34 5 11 27
g) Use technology to find the equation and coefficient of determination for each type of regression model. Use the number of practice throws for the input variable and the number of free throws for the output variable. Round all decimal values to three places.
(h) Which model best fits the data set? Explain.

Answers: 2
Another question on Mathematics
Mathematics, 21.06.2019 16:20
An equation representing lyle’s hedge-trimming business is a = 12n - 300 where a is the amount of profit or loss in dollars and n is the number of hedges trimmed. how would the graph of lyle’s business change if the equation a = 10n - 300 represented his business? the graph would be flatter. the graph would be steeper. the graph would start closer to the origin. the graph would start lower on the y-axis.
Answers: 2
Mathematics, 21.06.2019 22:30
Acampus club held a bake sale as a fund raiser, selling coffee, muffins, and bacon and eggs sandwiches. the club members charged $1 for a cup of coffee, 3$ for a muffin , and $4 for a back. and egg sandwich. they sold a total of 55 items , easing $119. of the club members sold 5 more muffins than cups of coffee, how many bacon and egg sandwiches he’s did they sell
Answers: 1
You know the right answer?
1) The table shows the distances, in meters, that each player in a game tossed a ball, and the total...
Questions
Mathematics, 26.03.2020 20:05

History, 26.03.2020 20:05
Mathematics, 26.03.2020 20:05


Biology, 26.03.2020 20:05
Biology, 26.03.2020 20:05

Mathematics, 26.03.2020 20:06
Mathematics, 26.03.2020 20:06
Mathematics, 26.03.2020 20:06
Mathematics, 26.03.2020 20:06


