
Mathematics, 12.05.2021 02:30 andersonrocksc
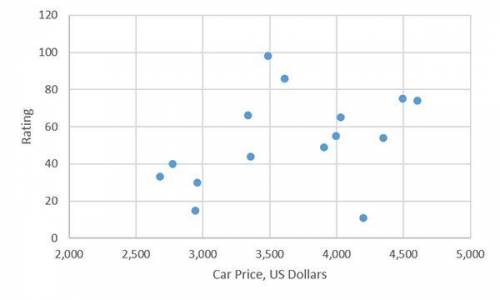
The cost and customer rating of 15 cars is shown on the scatterplot. The cars are rated on a scale of 0 to 100.
Part A: Describe the association shown in the scatterplot.
Part B: Give an example of a data point that affects the appropriateness of using a linear regression model to fit all the data. Explain. (4 points)
Part C: Give an example of a car that is cost effective and rated highly by customers.

Answers: 2
Another question on Mathematics
Mathematics, 21.06.2019 14:30
What is the volume of a rectangular prism if the length is 10.4 mm the width is 5 mm in the height is 8 mm
Answers: 1
Mathematics, 21.06.2019 16:40
How do i get my dad to stop making me gargle his pickle i want my mom to gargle my pickle not my dads
Answers: 3
Mathematics, 21.06.2019 18:00
Need on this geometry question. explain how you did it.
Answers: 2
You know the right answer?
The cost and customer rating of 15 cars is shown on the scatterplot. The cars are rated on a scale o...
Questions

History, 09.10.2019 00:10

Mathematics, 09.10.2019 00:10

English, 09.10.2019 00:10
Mathematics, 09.10.2019 00:10
Mathematics, 09.10.2019 00:10

Computers and Technology, 09.10.2019 00:10

Physics, 09.10.2019 00:10


French, 09.10.2019 00:10
English, 09.10.2019 00:10


Advanced Placement (AP), 09.10.2019 00:20
Mathematics, 09.10.2019 00:20
Mathematics, 09.10.2019 00:20


