
Mathematics, 11.05.2021 03:20 OsoDeOro7968
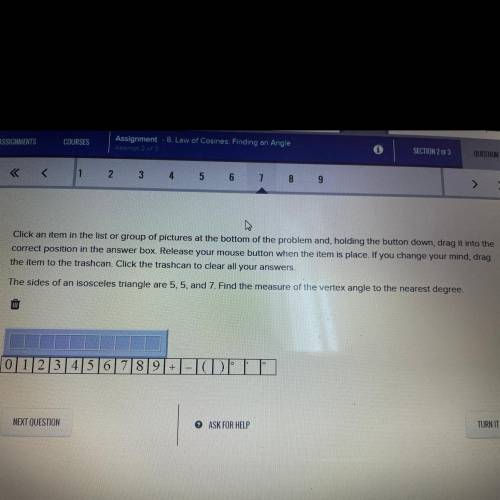
Click an item in the list or group of pictures at the bottom of the problem and, holding the button down, drag it into the
correct position in the answer box. Release your mouse button when the item is place. If you change your mind, drag
the item to the trashcan. Click the trashcan to clear all your answers.
The sides of an isosceles triangle are 5,5, and 7. Find the measure of the vertex angle to the nearest degree.

Answers: 1
Another question on Mathematics
Mathematics, 21.06.2019 22:30
Graph the system of inequalities presented here on your own paper, then use your graph to answer the following questions: y > 2x + 3y is less than negative 3 over 2 times x minus 4part a: describe the graph of the system, including shading and the types of lines graphed. provide a description of the solution area. (6 points)part b: is the point (â’4, 6) included in the solution area for the system? justify your answer mathematically. (4 points)
Answers: 1
Mathematics, 22.06.2019 00:50
Identify the statement below as either descriptive or inferential statistics. upper a certain website sold an average of 117 books per day last week. is the statement an example of descriptive or inferential statistics? a. it is an example of descriptive statistics because it uses a sample to make a claim about a population. b. it is an example of inferential statistics because it uses a sample to make a claim about a population. c. it is an example of inferential statistics because it summarizes the information in a sample. d. it is an example of descriptive statistics because it summarizes the information in a sample.
Answers: 1
Mathematics, 22.06.2019 01:30
How do u write a function for the reflection across the y axis
Answers: 1
Mathematics, 22.06.2019 01:30
Have you ever been in the middle of telling a story and had to use hand gestures or even a drawing to make your point? in algebra, if we want to illustrate or visualize a key feature of a function, sometimes we have to write the function in a different form—such as a table, graph, or equation—to determine the specific key feature we’re looking for. think about interactions with others and situations you’ve come across in your own life. how have you had to adjust or change the way you represented something based on either the concept you were trying to describe or the person you were interacting with? explain how the complexity or layout of the concept required you to change your style or presentation, or how the person’s unique learning style affected the way you presented the information.
Answers: 1
You know the right answer?
Click an item in the list or group of pictures at the bottom of the problem and, holding the button...
Questions


Geography, 20.09.2019 22:10


Mathematics, 20.09.2019 22:10


