
Mathematics, 10.05.2021 09:20 Itssata
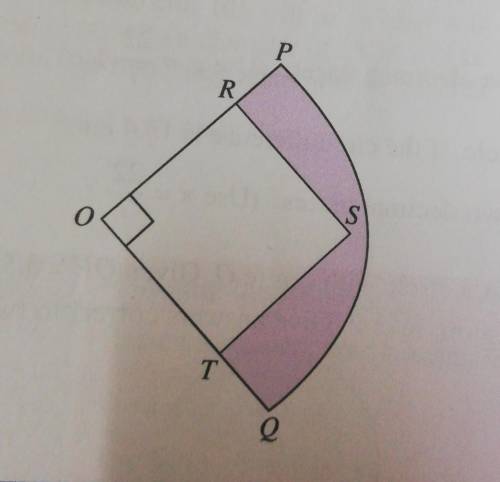
10. The diagram below shows the quadrant OPQ centred at 0. ORST is a square. Given OP= 10 cm and OR = 7 cm. Calculate the area of the shaded region, in cm². State the answer in \pi

Answers: 3
Another question on Mathematics
Mathematics, 21.06.2019 18:00
What set does not contain -3 the set of all real numbers the set of all integers the set of all whole numbers the set of all rational numbers
Answers: 1
Mathematics, 21.06.2019 20:50
There are three bags: a (contains 2 white and 4 red balls), b (8 white, 4 red) and c (1 white 3 red). you select one ball at random from each bag, observe that exactly two are white, but forget which ball came from which bag. what is the probability that you selected a white ball from bag a?
Answers: 1
Mathematics, 22.06.2019 02:00
Brittany has designed four different birdcages, each with the same volume: a square pyramid, a cylinder, a cone, and a sphere. the zoo wants to use one of brittany’s designs but plans to change the volume of the cage. find the design change that would result in the birdcage with the greatest volume. a.) increase the area of the base of the square pyramid by a factor of ten. b.) increase the height of the cylinder by a factor of ten. c.) increase the radius of the cone by a factor of ten. d.) increase the radius of a sphere by a factor of ten.
Answers: 1
Mathematics, 22.06.2019 02:00
1. the manager of collins import autos believes the number of cars sold in a day (q) depends on two factors: (1) the number of hours the dealership is open (h) and (2) the number of salespersons working that day (s). after collecting data for two months (53 days), the manager estimates the following log-linear model: q 4 equation 1 a. explain, how to transform the log-linear model into linear form that can be estimated using multiple regression analysis. the computer output for the multiple regression analysis is shown below: q4 table b. how do you interpret coefficients b and c? if the dealership increases the number of salespersons by 20%, what will be the percentage increase in daily sales? c. test the overall model for statistical significance at the 5% significance level. d. what percent of the total variation in daily auto sales is explained by this equation? what could you suggest to increase this percentage? e. test the intercept for statistical significance at the 5% level of significance. if h and s both equal 0, are sales expected to be 0? explain why or why not? f. test the estimated coefficient b for statistical significance. if the dealership decreases its hours of operation by 10%, what is the expected impact on daily sales?
Answers: 2
You know the right answer?
10. The diagram below shows the quadrant OPQ centred at 0. ORST is a square. Given OP= 10 cm
and O...
Questions


Health, 18.08.2019 19:30

Chemistry, 18.08.2019 19:30

English, 18.08.2019 19:30

Social Studies, 18.08.2019 19:30

History, 18.08.2019 19:30
Mathematics, 18.08.2019 19:30
Mathematics, 18.08.2019 19:30
History, 18.08.2019 19:30

Mathematics, 18.08.2019 19:30
Social Studies, 18.08.2019 19:30
Mathematics, 18.08.2019 19:30
Mathematics, 18.08.2019 19:30


