
Mathematics, 08.05.2021 03:10 riley01weaver1
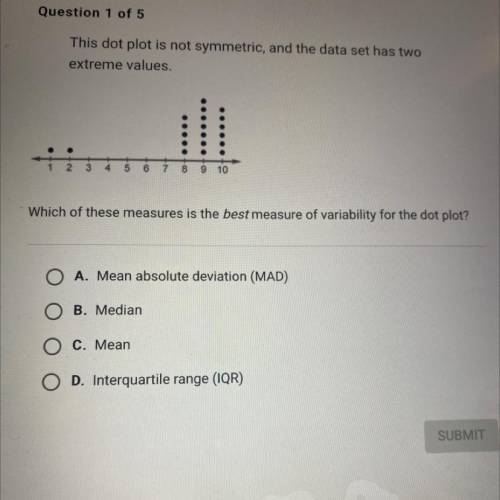
This dot plot is not symmetric in the data said has two extreme values which of these measures is the best measure of viability for the dot
plot?
A) mean absolute deviation
B) median
C) mean
D) interquartile range

Answers: 3
Another question on Mathematics
Mathematics, 21.06.2019 20:40
Reduce fractions expressing probability to lowest terms. in 3,000 repetitions of an experiment, a random event occurred in 500 cases. the expected probability of this event is?
Answers: 3
Mathematics, 21.06.2019 21:30
Handsome jack is buying a pony made of diamonds. the price of the pony is p dollars, and jack also has to pay a 25% diamond pony tax. which of the following expressions could represent how much jack pays in total for the pony?
Answers: 1
Mathematics, 22.06.2019 03:10
(co 3) the times that customers spend in a book store are normally distributed with a mean of 39.5 minutes and a standard deviation of 9.4 minutes. a random sample of 25 customers has a mean of 36.1 minutes or less. would this outcome be considered unusual, so that the store should reconsider its displays? no, the probability of this outcome at 0.035, would be considered usual, so there is no problem yes, the probability of this outcome at 0.035, would be considered unusual, so the display should be redone no the probability of this outcome at 0.359 would be considered usual, so there is no problem yes, the probability of this outcome at 0.965 would be considered unusual, so the display should be redone
Answers: 1
Mathematics, 22.06.2019 04:10
You are in charge of the customer service phone line with many employees. at the end of each phone callthe customers are asked to rate their service from 1 to 5 stars, with 5 being the best. you find the averagerating for 20 randomly selected employees and decide you want to improve the ratings so you require thoseemployees to go through a new training program. you then wait a week and find the new average rating foreach employee. the average change is an increase in 1.3 stars with a standard devation of .9 stars.(a) is this data paired or not paired? (b) what are the null and alternative hypothesis being tested? (c) what is the t-statistic you would use? write the general formula and the final calculation.(d) sketch a t-distribution, label your t-statistic and the probability you would be interested in:
Answers: 2
You know the right answer?
This dot plot is not symmetric in the data said has two extreme values which of these measures is th...
Questions


Computers and Technology, 29.07.2020 16:01

Mathematics, 29.07.2020 17:01
Mathematics, 29.07.2020 17:01

Mathematics, 29.07.2020 17:01
Mathematics, 29.07.2020 17:01


