
Mathematics, 07.05.2021 21:00 hokamidat
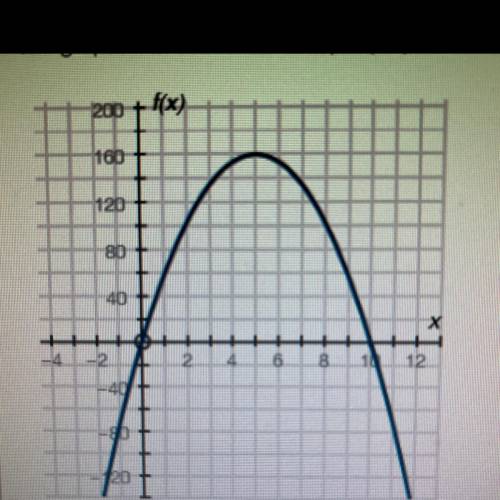
The graph below shows a company’s profit f(x), in dollars, depending on the price of pencils x, in dollars, being sold by the company:
Part A: What do the x-intercepts and maximum value of the graph represent? What are the intervals where the function is increasing and decreasing, and what do they represent about the sale and profit?
Part B: What is an approximate average rate of change of the graph from x = 2 to x = 5, and what does this rate represent?

Answers: 3
Another question on Mathematics
Mathematics, 21.06.2019 19:30
The measure of an angle is 117°. what is the measure of a supplementary angle?
Answers: 2
Mathematics, 21.06.2019 20:00
The radius of the earth is two times the radius of the moon. what fraction of the volume of the earth is the volume of the moon?
Answers: 1
Mathematics, 21.06.2019 21:00
Atorch and a battery cost 2.50 altogether.the torch costs 1.50 more than the battery.what fraction of the total price is the torch? give your answer in its simplest form.
Answers: 2
Mathematics, 22.06.2019 03:00
What is the approximate difference in tenths between √12 and √15?
Answers: 1
You know the right answer?
The graph below shows a company’s profit f(x), in dollars, depending on the price of pencils x, in d...
Questions

Chemistry, 05.05.2020 06:02
Mathematics, 05.05.2020 06:02
Chemistry, 05.05.2020 06:02


Mathematics, 05.05.2020 06:02
Mathematics, 05.05.2020 06:02

Mathematics, 05.05.2020 06:02
Mathematics, 05.05.2020 06:02


