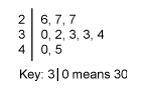
What is the median of the data in this stem-and-leaf plot?
31.0
31.5
32.0<...

Mathematics, 06.05.2021 19:40 keelyrosewillia
What is the median of the data in this stem-and-leaf plot?
31.0
31.5
32.0
32.5

Answers: 2
Another question on Mathematics
Mathematics, 21.06.2019 16:30
You are updating your garage and the only thing left to paint is your garage day. you're only going to paint the slide that faces the street. the garage door is 9 fert 8inches tall and 120 inches wide. you need to know the surface area of the side of the garage door to determine how much paint to buy. the hardware store sells paint by how much covers a square foot. what is the surface area you should report to the hardware store what is the answer
Answers: 3
Mathematics, 21.06.2019 19:00
Marina baked cookies. she gave 3/4 of the cookies to the scout bake sale. she shared the remaining 6 cookies with her friends. how many cookies did marina bake?
Answers: 3
Mathematics, 22.06.2019 01:40
At wind speeds above 1000 centimeters per second (cm/sec), significant sand-moving events begin to occur. wind speeds below 1000 cm/sec deposit sand and wind speeds above 1000 cm/sec move sand to new locations. the cyclic nature of wind and moving sand determines the shape and location of large dunes. at a test site, the prevailing direction of the wind did not change noticeably. however, the velocity did change. fifty-nine wind speed readings gave an average velocity of x = 1075 cm/sec. based on long-term experience, σ can be assumed to be 245 cm/sec. (a) find a 95% confidence interval for the population mean wind speed at this site. (round your answers to the nearest whole number.) lower limit cm/sec upper limit cm/sec
Answers: 2
Mathematics, 22.06.2019 04:20
When booking personal travel by air, one is always interested in actually arriving at one’s final destination even if that arrival is a bit late. the key variables we can typically try to control are the number of flight connections we have to make in route, and the amount of layover time we allow in those airports whenever we must make a connection. the key variables we have less control over are whether any particular flight will arrive at its destination late and, if late, how many minutes late it will be. for this assignment, the following necessarily-simplified assumptions describe our system of interest: the number of connections in route is a random variable with a poisson distribution, with an expected value of 1. the number of minutes of layover time allowed for each connection is based on a random variable with a poisson distribution (expected value 2) such that the allowed layover time is 15*(x+1). the probability that any particular flight segment will arrive late is a binomial distribution, with the probability of being late of 50%. if a flight arrives late, the number of minutes it is late is based on a random variable with an exponential distribution (lamda = .45) such that the minutes late (always rounded up to 10-minute values) is 10*(x+1). what is the probability of arriving at one’s final destination without having missed a connection? use excel.
Answers: 3
You know the right answer?
Questions


History, 24.12.2019 20:31


Computers and Technology, 24.12.2019 20:31


