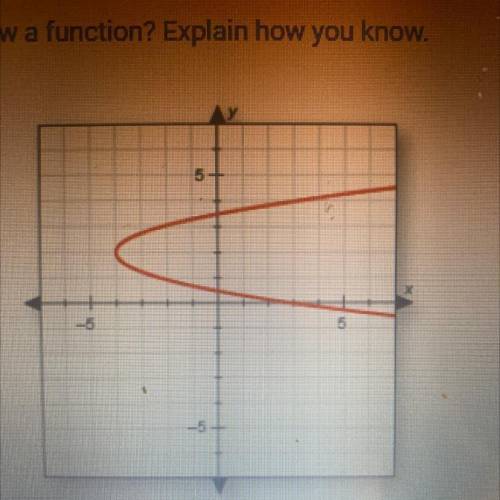
Does this graph show a function? Explain how you know.
O A.
Yes; there are no y-values that...

Mathematics, 04.05.2021 14:00 aide1234564
Does this graph show a function? Explain how you know.
O A.
Yes; there are no y-values that have more than one x-value.
• B. Yes; the graph passes the vertical line test.
C. No; the graph fails the vertical line test.
D. No; there are y-values that have more than one x-value.

Answers: 2
Another question on Mathematics
Mathematics, 21.06.2019 15:00
Asap the total attendance for all of a baseball league in 2012 was about 7.5×10⁷ fans, while the attendance for the tornadoes in 2012 was about 1.5×10⁶ fans. about how many times more was the attendance for the entire baseball league than the attendance for just the tornadoes? 50 times more 10 times more 2 times more 5 times more
Answers: 2
Mathematics, 21.06.2019 22:00
After a dreary day of rain, the sun peeks through the clouds and a rainbow forms. you notice the rainbow is the shape of a parabola. the equation for this parabola is y = -x2 + 36. graph of a parabola opening down at the vertex 0 comma 36 crossing the x–axis at negative 6 comma 0 and 6 comma 0. in the distance, an airplane is taking off. as it ascends during take-off, it makes a slanted line that cuts through the rainbow at two points. create a table of at least four values for the function that includes two points of intersection between the airplane and the rainbow. analyze the two functions. answer the following reflection questions in complete sentences. what is the domain and range of the rainbow? explain what the domain and range represent. do all of the values make sense in this situation? why or why not? what are the x- and y-intercepts of the rainbow? explain what each intercept represents. is the linear function you created with your table positive or negative? explain. what are the solutions or solution to the system of equations created? explain what it or they represent. create your own piecewise function with at least two functions. explain, using complete sentences, the steps for graphing the function. graph the function by hand or using a graphing software of your choice (remember to submit the graph).
Answers: 2
Mathematics, 22.06.2019 00:30
The graph of f(x) is obtained by reflecting the graph of f(x)=-3|x| over the x-axis. which equation describes f(x)? a) f(x)=3|x| b) f(x)=|x+3| c) f(x)=-3|x| d) f(x) = - |x+3|
Answers: 1
Mathematics, 22.06.2019 04:00
What value of s iwhat value of s is a solution to this equation? 27+6s=9ss a solution to this equation? 27+6s=9s
Answers: 1
You know the right answer?
Questions


History, 26.03.2020 04:36
Chemistry, 26.03.2020 04:36
English, 26.03.2020 04:36
Mathematics, 26.03.2020 04:36
Mathematics, 26.03.2020 04:36


Mathematics, 26.03.2020 04:36


