
Mathematics, 01.05.2021 03:50 isabellamason5900
Helpp plzz asapp!! NO LINKS!
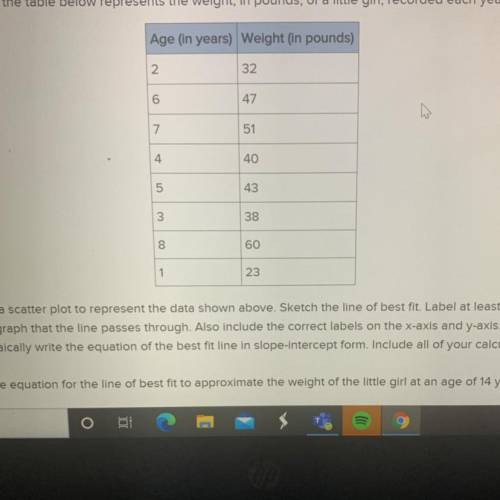
The data shown in the table below represents the weight, in pounds, of a little girl, recorded each year on her birthday.
Part A Create a scatter plot to represent the data shown above. Sketch the line of best fit. Label at least three specific
points on the graph that the line passes through. Also include the correct labels on the x-axis and yaxis.
Part B Algebraically write the equation of the best fit line in slope-intercept form. Include all of your calculations in your
final answer
Part C. Use the equation for the line of best fit to approximate the weight of the little girl at an age of 14 years old

Answers: 1
Another question on Mathematics
Mathematics, 21.06.2019 19:00
Analyze the graph of the cube root function shown on the right to determine the transformations of the parent function. then, determine the values of a, h, and k in the general equation. y=a3x-h+k h= . k= done 000000l o 7 of 8
Answers: 2
Mathematics, 21.06.2019 19:00
Witch represents the inverse of the function f(x)=1/4x-12
Answers: 1
Mathematics, 21.06.2019 23:40
Which point-slope form equation represents a line that passes through (3,-2) with a slope of -4/5
Answers: 1
Mathematics, 22.06.2019 00:50
Match the following reasons with the statements given to create the proof. 1. do = ob, ao = oc sas 2. doc = aob given 3. triangle cod congruent to triangle aob vertical angles are equal. 4. 1 = 2, ab = dc if two sides = and ||, then a parallelogram. 5. ab||dc if alternate interior angles =, then lines parallel. 6. abcd is a parallelogram cpcte
Answers: 3
You know the right answer?
Helpp plzz asapp!! NO LINKS!
The data shown in the table below represents the weight, in pounds, o...
Questions


Computers and Technology, 07.11.2019 23:31


