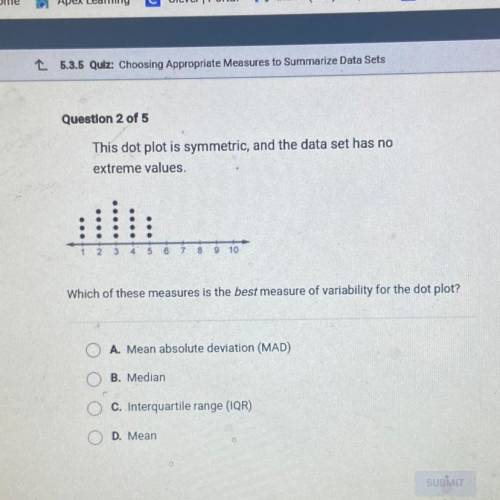
This dot plot is symmetric, and the data set has no
extreme values.
2 3 4 5 6
9 10
Which of these measures is the best measure of variability for the dot plot?
A. Mean absolute deviation (MAD)
B. Median
OOO
C. Interquartile range (IQR)
D. Mean
The frequency table shows the results of a survey comparing the number of beach towels sold for full price and at a discount during each of the three summer months. the store owner converts the frequency table to a conditional relative frequency table by row. which value should he use for x? round to the nearest hundredth. 0.89 0.90 0.92 0.96