
Mathematics, 24.04.2021 14:00 shadley6825
FILL IN THE BLANK PLEASE HELP
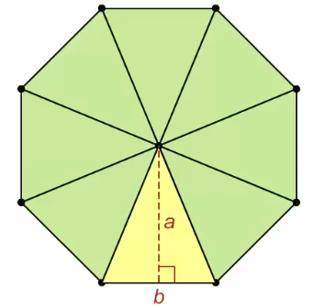
Using the diagram of a regular hexagon, fill in the blanks for the steps to solve for the area of a hexagon with sides equal to 8 cm.
(1) How many equilateral triangles are there? _
(2) What is the measure of each of the three angles in the equilateral triangle? _
(3) If we cut an equilateral triangle down the middle (red line), what special right triangle do you create? _
(4) What is the vocabulary word for the red line? _
(5) What is the length of the short side of one 30-60-90 triangle? _
(6) What is the length of the hypotenuse of one 30-60-90 triangle? _
(7) Using the properties of 30-60-90 triangles, calculate the length of the long leg. _
(8) What is the height of the equilateral triangle? _
(9) Apply the formula for the area of a triangle to find the area of one equilateral triangle. _
(10) Calculate the area of the complete hexagon by multiplying the area of one equilateral triangle by the number of triangles. _

Answers: 3
Another question on Mathematics
Mathematics, 21.06.2019 16:00
Part one: measurements 1. measure your own height and arm span (from finger-tip to finger-tip) in inches. you will likely need some from a parent, guardian, or sibling to get accurate measurements. record your measurements on the "data record" document. use the "data record" to you complete part two of this project. name relationship to student x height in inches y arm span in inches archie dad 72 72 ginelle mom 65 66 sarah sister 64 65 meleah sister 66 3/4 67 rachel sister 53 1/2 53 emily auntie 66 1/2 66 hannah myself 66 1/2 69 part two: representation of data with plots 1. using graphing software of your choice, create a scatter plot of your data. predict the line of best fit, and sketch it on your graph. part three: the line of best fit include your scatter plot and the answers to the following questions in your word processing document 1. 1. which variable did you plot on the x-axis, and which variable did you plot on the y-axis? explain why you assigned the variables in that way. 2. write the equation of the line of best fit using the slope-intercept formula $y = mx + b$. show all your work, including the points used to determine the slope and how the equation was determined. 3. what does the slope of the line represent within the context of your graph? what does the y-intercept represent? 5. use the line of best fit to you to describe the data correlation.
Answers: 2
Mathematics, 21.06.2019 22:30
The median for the given set of six ordered data values is 29.5 9 12 25 __ 41 48 what is the missing value?
Answers: 1
Mathematics, 22.06.2019 00:00
30 points! here is a you are the new manager at trusty goods wholesale produce. you need to figure out how to adjust the amount of produce in your notes after the events of the day: you got 5 more crates of bananas someone returned 2 crates of apples a worker dropped a crate of grapes (oh no! , you had to throw them out) you sold a crate of bananas you sold 5 crates of apples can you write an expression to describe your day using: "a" for crates of apples "b" for crates of bananas and "g" for crates of grapes? make sure the expression is in simplest form question 2 (3 points) explain your steps using sentences.
Answers: 2
Mathematics, 22.06.2019 07:10
Find the absolute maximum and minimum values of f(x.y)=x^2+y^2-2x-2y on the closed region bounded by the triangle with vertices (0,0), (2,0), and (0,2)
Answers: 3
You know the right answer?
FILL IN THE BLANK PLEASE HELP
Using the diagram of a regular hexagon, fill in the blanks for the s...
Questions


Physics, 24.07.2019 19:10

History, 24.07.2019 19:10
Mathematics, 24.07.2019 19:10
Mathematics, 24.07.2019 19:10


