X 8.4.AP-4
Question Help
The table below shows the average temperature in a particular city...

Mathematics, 23.04.2021 23:30 tushema1
X 8.4.AP-4
Question Help
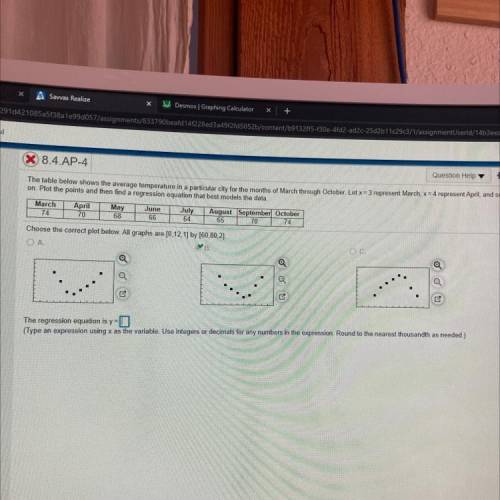
The table below shows the average temperature in a particular city for the months of March through October. Let x= 3 represent March, x = 4 represent April, and so
on. Plot the points and then find a regression equation that best models the data.
March April May June July August September October
74 70 68 66 64 65 70 74
Choose the correct plot below. All graphs are [0,12,1] by [60,80,2).
OA.
B.
OC.
Q
a
Q
a
The regression equation is y=0
(Type an expression using x as the variable. Use integers or decimals for any numbers in the expression Round to the nearest thousandth as needed.)

Answers: 1
Another question on Mathematics
Mathematics, 21.06.2019 16:00
Find the greatest common factor of the polynomial: 10x^5+15x^4-25x^3 10x^5 x^3 5x^3 5
Answers: 2
Mathematics, 21.06.2019 16:20
Which best explains why this triangle is or is not a right triangle?
Answers: 1
Mathematics, 22.06.2019 00:00
How many liters of peroxide should be added to 12 liters of an 8% peroxide solution so that the resulting solution contains 16% peroxide? original added new amount of peroxide 0.96 liters x 0.96 + x amount of solution 12 liters x 12 + x 0.18 liter 1.14 liters 1.92 liters 2.10 liters
Answers: 1
You know the right answer?
Questions
Mathematics, 11.02.2020 03:17

History, 11.02.2020 03:17


English, 11.02.2020 03:17
Mathematics, 11.02.2020 03:17

Chemistry, 11.02.2020 03:17
Mathematics, 11.02.2020 03:17

Mathematics, 11.02.2020 03:18


Computers and Technology, 11.02.2020 03:18
Mathematics, 11.02.2020 03:18
Mathematics, 11.02.2020 03:18


