this is my last question and i've been waiting 40 minutes
the graph below shows the heig...

Mathematics, 19.10.2019 14:30 dexy8683
this is my last question and i've been waiting 40 minutes
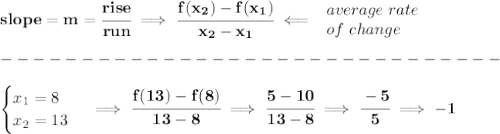
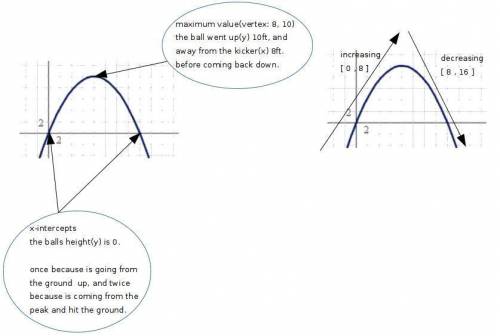
the graph below shows the height of a kicked soccer ball f(x), in feet, depending on the distance from the kicker x, in feet:
graph of quadratic function f(x) having x intercepts at ordered pairs (0, 0) and (16, 0). the vertex is at (8, 10).
part a: what do the x-intercepts and maximum value of the graph represent? what are the intervals where the function is increasing and decreasing, and what do they represent about the distance and height?
part b: what is an approximate average rate of change of the graph from x = 8 to x = 13, and what does this rate represent?

Answers: 3
Another question on Mathematics
Mathematics, 21.06.2019 18:20
What value of x is in the solution set of 4x - 12 s 16 + 8x? -10 -9 -8 -7
Answers: 1
Mathematics, 21.06.2019 20:30
Ateam has p points. p = 3w + d w = wins d = draws a) a football team has 5 wins and 3 draws. how many points does the team have?
Answers: 1
Mathematics, 21.06.2019 22:30
What is the common difference for this arithmetic sequence? -6,-2,2,6,10 a.4 b.5 c.3 d.6
Answers: 1
Mathematics, 22.06.2019 00:30
How can you check that you have correctly converted frequencies to relative frequencies?
Answers: 1
You know the right answer?
Questions


Spanish, 28.05.2021 03:00
Mathematics, 28.05.2021 03:00

Advanced Placement (AP), 28.05.2021 03:00
History, 28.05.2021 03:00
History, 28.05.2021 03:00


Mathematics, 28.05.2021 03:00
English, 28.05.2021 03:00


