
Mathematics, 08.10.2019 05:30 phillswift2020
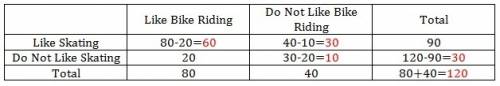
Agroup of students were surveyed to find out if they like bike riding and/or roller skating as a hobby. the results of the survey are shown below:
80 students like bike riding
20 students like bike riding but do not like skating
90 students like skating
40 students do not like bike riding
make a two-way table to represent the data and use the table to answer the following questions.
part a: what percentage of the total students surveyed like both bike riding and skating? show your work. (5 points)
part b: what is the probability that a student who does not like bike riding also does not like skating?

Answers: 1
Another question on Mathematics
Mathematics, 21.06.2019 15:30
Avegetable garden and a surrounding path are shaped like a square that together are 11ft wide. the path is 2ft wide. find the total area of the vegetable garden and path
Answers: 1
Mathematics, 21.06.2019 17:00
(! ) three cylinders have a height of 8 cm. cylinder 1 has a radius of 1 cm. cylinder 2 has a radius of 2 cm. cylinder 3 has a radius of 3 cm. find the volume of each cylinder
Answers: 1
You know the right answer?
Agroup of students were surveyed to find out if they like bike riding and/or roller skating as a hob...
Questions

Biology, 19.05.2020 02:01
Mathematics, 19.05.2020 02:01
Mathematics, 19.05.2020 02:01
Mathematics, 19.05.2020 02:01

History, 19.05.2020 02:01
Mathematics, 19.05.2020 02:01

Geography, 19.05.2020 02:01

Mathematics, 19.05.2020 02:01

English, 19.05.2020 02:01
English, 19.05.2020 02:01
Biology, 19.05.2020 02:01


