The graph shows the distance, y, that a car traveled in x hours:
a graph is shown with...

Mathematics, 23.01.2020 19:31 bella6786
The graph shows the distance, y, that a car traveled in x hours:
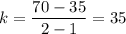
a graph is shown with x axis title as time in hours. the title on the y axis is distance traveled in miles. the values on the x axis are from 0 to 5 in increments of 1 for each grid line. the values on the y axis are from 0 to175 in increments of 35 for each grid line. a line is shown connecting ordered pairs 1, 35 and 2, 70 and 3, 105 and 4, 140. the title of the graph is rate of travel.
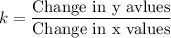
what is the rate of change for the relationship represented in the graph?
fraction 1 over 35
fraction 1 over 34
34
35

Answers: 2
Another question on Mathematics
Mathematics, 21.06.2019 16:20
Abank gives 6.5% interest per year. what is the growth factor b in this situation?
Answers: 3
Mathematics, 21.06.2019 20:00
An investment decreases in value by 30% in the first year and decreases by 40% in the second year. what is the percent decrease in percentage in the investment after two years
Answers: 1
Mathematics, 21.06.2019 21:00
Mr. thompson is on a diet. he currently weighs 260 pounds. he loses 4 pounds per month. what part of the story makes the relationship not proportional?
Answers: 3
Mathematics, 22.06.2019 03:50
The weekly amount spent by a company for travel has an approximately normal distribution with mean = $550 and standard deviation = $40. a) what is the probability that the actual weekly expense will exceed $570 for more than 20 weeks during the next year? (note: one year = 52 weeks) b) what is the probability that actual weekly expenses exceed $580 for 10 or more, but 16 or fewer weeks during the next year?
Answers: 2
You know the right answer?
Questions


Arts, 16.10.2021 18:00
SAT, 16.10.2021 18:00

Mathematics, 16.10.2021 18:10


History, 16.10.2021 18:10

Spanish, 16.10.2021 18:10
Social Studies, 16.10.2021 18:10
Biology, 16.10.2021 18:10


