
Mathematics, 10.10.2019 08:00 sanchitcoolcham7362
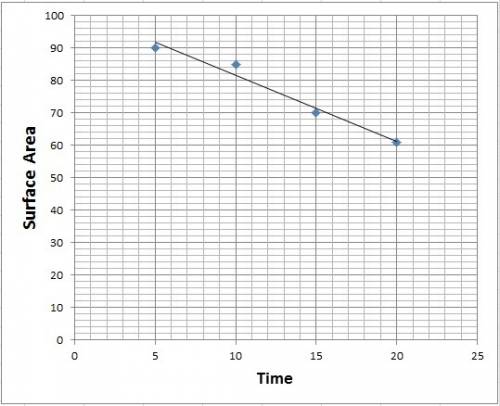
The table below shows the surface area y, in square feet, of a shrinking lake in x days:
time (x)
(days) 5 10 15 20
surface area (y)
(square feet) 90 85 70 61
part a: what is the most likely value of the correlation coefficient of the data in the table? based on the correlation coefficient, describe the relationship between time and surface area of the lake. [choose the value of the correlation coefficient from −1, −0.98, −0.5, −0.02.] (4 points)
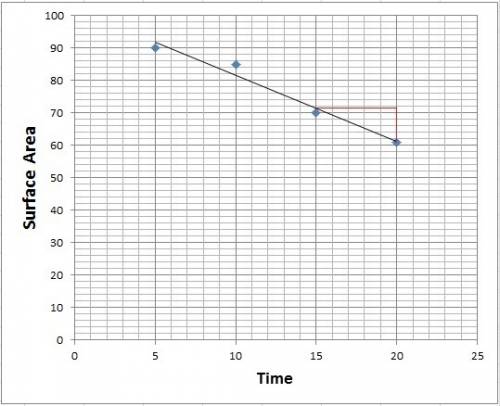
part b: what is the value of the slope of the graph of surface area versus time between 15 and 20 days, and what does the slope represent? (3 points)
part c: does the data in the table represent correlation or causation? explain your answer. (3 points)

Answers: 1
Another question on Mathematics
Mathematics, 21.06.2019 16:00
What are the related frequencies to the nearest hundredth of the columns of the two way table? group 1: a-102 b-34group 2: a-18 b-14edited: i don’t have all day to be waiting for an answer. i figured it out.
Answers: 2
Mathematics, 21.06.2019 21:30
Two friends are reading books. jimmy reads a book with 21,356 words. his friend bob reads a book with one-and-a-half times as many words. which expression represents the number of words bob reads?
Answers: 3
Mathematics, 21.06.2019 23:00
Unaware that 35% of the 10000 voters in his constituency support him, a politician decides to estimate his political strength. a sample of 200 voters shows that 40% support him. a. what is the population? b. what is the parameter of interest? state its value c. what is the statistics of the interest? state its value d. compare your answers in (b) and (c) is it surprising they are different? if the politician were to sample another 200 voters, which of the two numbers would most likely change? explain
Answers: 2
Mathematics, 22.06.2019 00:40
What is the interquartile range (iqr) of the data set represented by this box plot?
Answers: 3
You know the right answer?
The table below shows the surface area y, in square feet, of a shrinking lake in x days:
Questions


Mathematics, 18.12.2020 02:50
Mathematics, 18.12.2020 02:50

Chemistry, 18.12.2020 02:50
Biology, 18.12.2020 02:50
Mathematics, 18.12.2020 02:50
Mathematics, 18.12.2020 02:50
Mathematics, 18.12.2020 02:50
English, 18.12.2020 02:50

SAT, 18.12.2020 02:50

Computers and Technology, 18.12.2020 02:50

Arts, 18.12.2020 02:50


