
Mathematics, 17.11.2019 21:31 boog89
The following table shows the number of hours some high school students in two towns spend watching tv each week:
town a
16
25
42
38
17
32
42
10
17
town b
8
0
0
17
30
8
21
9
19
part a: create a five-number summary and calculate the interquartile range for the two sets of data. (6 points)
part b: are the box plots symmetric? justify your answer. (4 points)

Answers: 2
 = 16.5 (The value falls between 16 and 17)
 = 25
= 25 = 40 (The middle value between 38 and 42)
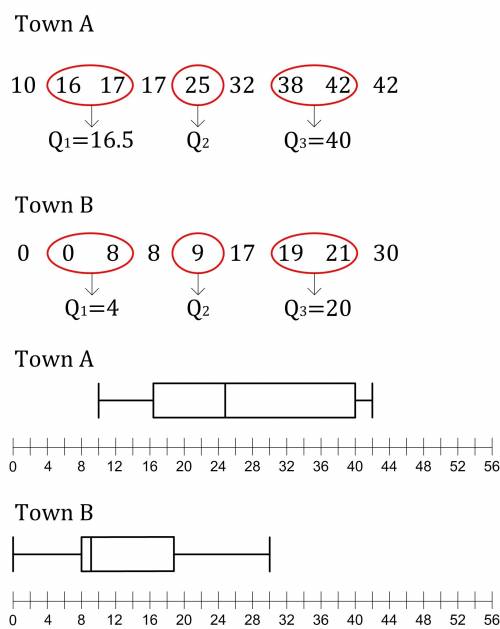
Another question on Mathematics
Mathematics, 21.06.2019 19:50
Drag each tile into the correct box. not all tiles will be used. find the tables with unit rates greater than the unit rate in the graph. then tenge these tables in order from least to greatest unit rate
Answers: 2
Mathematics, 21.06.2019 22:00
The customer price index(cpi), which measures the cost of a typical package of customer goods,was 208.8 in 2011 and 244.1 in 2016.let x=11 corresponding to the year 2011 an estimate to cpi into 2013 and 2014. assume that the data can be modeled by a straight line and the trend to continue idenfinitely.use data points to find such a line and then estimate the requested quantities
Answers: 1
Mathematics, 22.06.2019 00:00
Question 6(multiple choice worth 5 points) (05.02 lc) what is the value of x? a right angle is shown divided into two parts. the measure of one part of the right angle is 10 degrees. the measure of the other part is 2x 20 40 45 85
Answers: 1
Mathematics, 22.06.2019 00:30
Ms. green tells you that a right triangle has a hypotenuse if 13 and a leg of 5. she ask you to find the other leg of the triangle. what is you're answer?
Answers: 2
You know the right answer?
The following table shows the number of hours some high school students in two towns spend watching...
Questions

Physics, 19.07.2019 01:30

Chemistry, 19.07.2019 01:30


Computers and Technology, 19.07.2019 01:30
Mathematics, 19.07.2019 01:30
Computers and Technology, 19.07.2019 01:30
Chemistry, 19.07.2019 01:30

Biology, 19.07.2019 01:30
Computers and Technology, 19.07.2019 01:30
Computers and Technology, 19.07.2019 01:30
Computers and Technology, 19.07.2019 01:30
Physics, 19.07.2019 01:30


