Minutes studying test grade 20 65 22 65 25 50 25 52 30 55 30 68 45 70 45 69 60 75 75 80 90 78 90 83 90 85 100 88 100 78 110 95 120 96 120 100 150 91 the chart shows the number of minutes students spent studying for a test and their grade on the test. draw a scatterplot of the data.
which equation is closest to the line of best fit?
Robin spent 25% more time on his research project than he had planned he’s been an extra h ours on the project which of the following expressions could represent the number of hours rob actually spent on the project
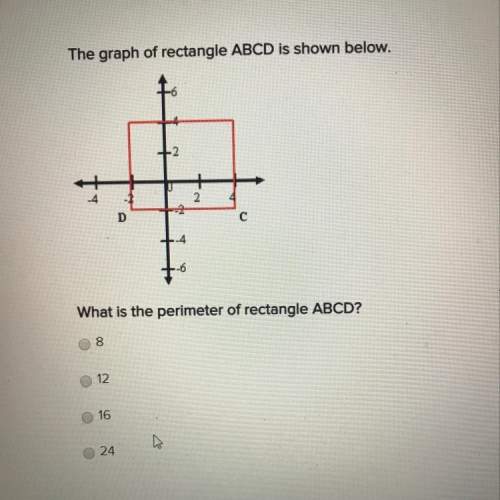
Mr. barth is painting an arrow on the school parking lot. he plots the arrow on the coordinate plane as shown below. what is the area of the arrow he is painting?