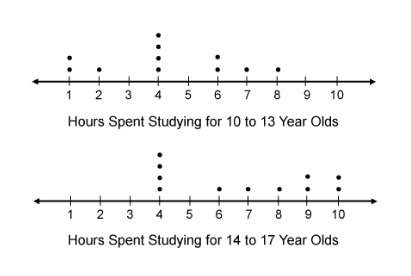
The line plots show the number of hours two groups of kids spent studying last weekend.
how do...

Mathematics, 02.09.2019 18:40 carma43
The line plots show the number of hours two groups of kids spent studying last weekend.
how does the data compare for the two groups of kids?
a: the 14- to 17-year olds spent more hours studying, on average, last weekend than the 10- to 13-year olds.
b: the median value for the hours spent studying last weekend for the 10- to 13-year olds is greater than the median value for the hours spent studying last weekend for the 14- to 17-year olds.
c: the 10- to 13-year olds spent an average of 6 hours studying last weekend.
d: the range for the hours spent studying last weekend for the 10- to 13-year olds is the same as the range for the hours spent studying last weekend for the 14- to 17-year olds.

Answers: 2
Another question on Mathematics
Mathematics, 21.06.2019 18:10
Drag the tiles to the boxes to form correct pairs. not all tiles will be used. match each set of vertices with the type of quadrilateral they form
Answers: 3
Mathematics, 21.06.2019 22:40
20.ju inces. which ordered pair is a viable solution if x represents the number of books he orders and y represents the total weight of the books, in ounces? (-3,-18) (-0.5, -3) (0,0) (0.5, 3)
Answers: 1
You know the right answer?
Questions

Business, 18.10.2019 00:30


Social Studies, 18.10.2019 00:30
Mathematics, 18.10.2019 00:30

World Languages, 18.10.2019 00:30
Mathematics, 18.10.2019 00:30
Social Studies, 18.10.2019 00:30

Biology, 18.10.2019 00:30

History, 18.10.2019 00:30
History, 18.10.2019 00:30
Mathematics, 18.10.2019 00:30
Mathematics, 18.10.2019 00:30

Geography, 18.10.2019 00:30
Mathematics, 18.10.2019 00:30
Biology, 18.10.2019 00:30
Biology, 18.10.2019 00:30


