
Mathematics, 19.11.2019 09:31 orlando19882000
The dot plot below shows the amount of time two random groups of students took to solve a puzzle:
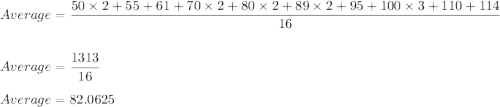
a dot plot shows puzzle solving time in seconds on the horizontal axis. for group a, there is 1 dot on 65, 1 dot on 67, 1 dot on 77, 1 dot on 79, 1 dot on 88, 1 dot on 90, 2 dots on 92, 1 dot on 100, 2 dots on 102, 1 dot on 109, 1 dot on 110, 2 dots on 112, 1 dot on 122, 1 dot on 136, and 1 dot on 139. for group b, there are 2 dots on 50, 1 dot on 55, 1 dot on 61, 2 dots on 70, 2 dots on 80, 2 dots on 89, 1 dot on 95, 3 dots on 100, 1 dot on 110, and 1 dot on 114.
based on visual inspection of the dot plots, which of the following groups, if any, shows a greater average time required to solve the puzzle?
group a
group b
both groups show about the same average time.
no conclusion about average time can be made from the data.

Answers: 3

Another question on Mathematics
Mathematics, 21.06.2019 15:20
If x=-3 is the only x-intercept of the graph of a quadratic equation, which statement best discribes the discriminant of the equation?
Answers: 1
Mathematics, 21.06.2019 20:00
Evaluate the discriminant of each equation. tell how many solutions each equation has and whether the solutions are real or imaginary. x^2 + 4x + 5 = 0
Answers: 2
Mathematics, 21.06.2019 23:20
Point r divides in the ratio 1 : 5. if the coordinates of e and f are (4, 8) and (11, 4), respectively, what are the coordinates of r to two decimal places?
Answers: 3
Mathematics, 22.06.2019 02:30
Ablue whale traveled 3112 miles in 214hours. what was the whale's rate in yards per hour? (1 mile = 1,760 yards)
Answers: 1
You know the right answer?
The dot plot below shows the amount of time two random groups of students took to solve a puzzle:
Questions


Mathematics, 22.08.2019 22:30

Physics, 22.08.2019 22:30
History, 22.08.2019 22:30
English, 22.08.2019 22:30
Mathematics, 22.08.2019 22:30

Social Studies, 22.08.2019 22:30


Biology, 22.08.2019 22:30
Biology, 22.08.2019 22:30
Mathematics, 22.08.2019 22:30
Mathematics, 22.08.2019 22:30
Mathematics, 22.08.2019 22:30
Mathematics, 22.08.2019 22:30
Social Studies, 22.08.2019 22:30

Business, 22.08.2019 22:30


