
Mathematics, 14.10.2019 12:20 bryanmcmillianjr
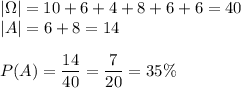
The table shows the results of rolling a number cube, with sides labeled 1 through 6, several times.
what is the experimental probability of rolling a 2 or a 4?
express your answer in simplest form.
outcome 1 2 3 4 5 6
number of times
outcome occurred 10 6 4 8 6 6

Answers: 1
Another question on Mathematics
Mathematics, 21.06.2019 15:50
Assemble the proof by dragging tiles to the statements and reasons column
Answers: 2
Mathematics, 21.06.2019 16:10
The box plot shows the number of raisins found in sample boxes from brand c and from brand d. each box weighs the same. what could you infer by comparing the range of the data for each brand? a) a box of raisins from either brand has about 28 raisins. b) the number of raisins in boxes from brand c varies more than boxes from brand d. c) the number of raisins in boxes from brand d varies more than boxes from brand c. d) the number of raisins in boxes from either brand varies about the same.
Answers: 2
Mathematics, 21.06.2019 19:30
The table below represents the displacement of a fish from its reef as a function of time: time (hours) x displacement from reef (feet) y 0 4 1 64 2 124 3 184 4 244 part a: what is the y-intercept of the function, and what does this tell you about the fish? (4 points) part b: calculate the average rate of change of the function represented by the table between x = 1 to x = 3 hours, and tell what the average rate represents. (4 points) part c: what would be the domain of the function if the fish continued to swim at this rate until it traveled 724 feet from the reef? (2 points)
Answers: 2
You know the right answer?
The table shows the results of rolling a number cube, with sides labeled 1 through 6, several times....
Questions
Mathematics, 18.07.2019 00:30


Mathematics, 18.07.2019 00:30

History, 18.07.2019 00:30
Mathematics, 18.07.2019 00:30
History, 18.07.2019 00:30
Mathematics, 18.07.2019 00:30
Chemistry, 18.07.2019 00:30


