 =
= 
 =
= 
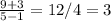
Use the points (1, -3) and (5, 9) for the following problems.
a. determine the slope between...

Mathematics, 16.11.2019 22:31 shakira11harvey6
Use the points (1, -3) and (5, 9) for the following problems.
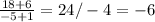
a. determine the slope between the two points above using the slope formula. show all work. the slope has to be (-1,-6), and (-5, 18)
b. use the slope from part (
a. and one point from above to write the equation in point-slope form.
c. transform the equation in part (
b. to slope intercept form.

Answers: 2
Another question on Mathematics
Mathematics, 21.06.2019 16:10
In a sample of 200 residents of georgetown county, 120 reported they believed the county real estate taxes were too high. develop a 95 percent confidence interval for the proportion of residents who believe the tax rate is too high. (round your answers to 3 decimal places.) confidence interval for the proportion of residents is up to . would it be reasonable to conclude that the majority of the taxpayers feel that the taxes are too high?
Answers: 3
Mathematics, 21.06.2019 16:30
Karen is financing $291,875 to purchase a house. she obtained a 15/5 balloon mortgage at 5.35%. what will her balloon payment be? a. $220,089.34 b. $219,112.46 c. $246,181.39 d. $230,834.98
Answers: 2
Mathematics, 21.06.2019 22:00
Find two numbers if their sum is 91 and the ratio is 6: 7?
Answers: 1
Mathematics, 22.06.2019 03:00
Describe how the presence of possible outliers might be identified on the following. (a) histograms gap between the first bar and the rest of bars or between the last bar and the rest of bars large group of bars to the left or right of a gap higher center bar than surrounding bars gap around the center of the histogram higher far left or right bar than surrounding bars (b) dotplots large gap around the center of the data large gap between data on the far left side or the far right side and the rest of the data large groups of data to the left or right of a gap large group of data in the center of the dotplot large group of data on the left or right of the dotplot (c) stem-and-leaf displays several empty stems in the center of the stem-and-leaf display large group of data in stems on one of the far sides of the stem-and-leaf display large group of data near a gap several empty stems after stem including the lowest values or before stem including the highest values large group of data in the center stems (d) box-and-whisker plots data within the fences placed at q1 â’ 1.5(iqr) and at q3 + 1.5(iqr) data beyond the fences placed at q1 â’ 2(iqr) and at q3 + 2(iqr) data within the fences placed at q1 â’ 2(iqr) and at q3 + 2(iqr) data beyond the fences placed at q1 â’ 1.5(iqr) and at q3 + 1.5(iqr) data beyond the fences placed at q1 â’ 1(iqr) and at q3 + 1(iqr)
Answers: 1
You know the right answer?
Questions

Social Studies, 24.09.2019 00:30

Mathematics, 24.09.2019 00:30
Mathematics, 24.09.2019 00:30
Mathematics, 24.09.2019 00:30

Chemistry, 24.09.2019 00:30

Biology, 24.09.2019 00:30

History, 24.09.2019 00:30

Mathematics, 24.09.2019 00:30
English, 24.09.2019 00:30
English, 24.09.2019 00:30
Mathematics, 24.09.2019 00:30
Mathematics, 24.09.2019 00:30
History, 24.09.2019 00:30


