
Mathematics, 30.01.2020 16:48 KaseyT
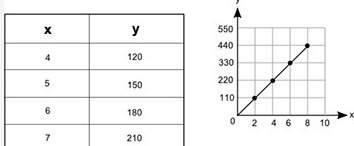
The table and the graph below each show a different relationship between the same two variables, x and y:
*insert attached picture here*
how much more would the value of y be on the graph than its value in the table when x = 12?
i added the y values for both until i got twelve and i subtracted the table's final y value from the graph's. i ended up with 410 but the only answer choices are:
150
300
450
600
what am i doing wrong?

Answers: 2
Another question on Mathematics
Mathematics, 21.06.2019 15:30
James is playing his favorite game at the arcade. after playing the game 3 times, he has 8 tokens remaining. he initially had 20 tokens, and the game costs the same number of tokens each time. the number tt of tokens james has is a function of gg, the number of games he plays
Answers: 2
Mathematics, 21.06.2019 23:30
(c) compare the results of parts (a) and (b). in general, how do you think the mode, median, and mean are affected when each data value in a set is multiplied by the same constant? multiplying each data value by the same constant c results in the mode, median, and mean increasing by a factor of c. multiplying each data value by the same constant c results in the mode, median, and mean remaining the same. multiplying each data value by the same constant c results in the mode, median, and mean decreasing by a factor of c. there is no distinct pattern when each data value is multiplied by the same constant. (d) suppose you have information about average heights of a random sample of airline passengers. the mode is 65 inches, the median is 72 inches, and the mean is 65 inches. to convert the data into centimeters, multiply each data value by 2.54. what are the values of the mode, median, and mean in centimeters? (enter your answers to two decimal places.) mode cm median cm mean cm in this problem, we explore the effect on the mean, median, and mode of multiplying each data value by the same number. consider the following data set 7, 7, 8, 11, 15. (a) compute the mode, median, and mean. (enter your answers to one (1) decimal places.) mean value = median = mode = (b) multiply 3 to each of the data values. compute the mode, median, and mean. (enter your answers to one (1) decimal places.) mean value = median = mode = --
Answers: 1
Mathematics, 21.06.2019 23:30
In a study of the relationship between socio-economic class and unethical behavior, 129 university of california undergraduates at berkeley were asked to identify themselves as having low or high social-class by comparing themselves to others with the most (least) money, most (least) education, and most (least) respected jobs. they were also presented with a jar of individually wrapped candies and informed that the candies were for children in a nearby laboratory, but that they could take some if they wanted. after completing some unrelated tasks, participants reported the number of candies they had taken. it was found that those who were identiď¬ed as upper-class took more candy than others. in this study, identify: (a) the cases, (b) the variables and their types, (c) the main research question, (d) identify the population of interest and the sample in this study, and (e) comment on whether or not the results of the study can be generalized to the population, and if the ď¬ndings of the study can be used to establish causal relationships.
Answers: 2
You know the right answer?
The table and the graph below each show a different relationship between the same two variables, x a...
Questions
Mathematics, 24.02.2021 09:50


History, 24.02.2021 09:50

Geography, 24.02.2021 09:50

Chemistry, 24.02.2021 09:50
History, 24.02.2021 09:50
Mathematics, 24.02.2021 09:50

English, 24.02.2021 09:50
Arts, 24.02.2021 09:50

Mathematics, 24.02.2021 09:50
Engineering, 24.02.2021 09:50
English, 24.02.2021 09:50
Mathematics, 24.02.2021 09:50
Mathematics, 24.02.2021 09:50


