
Mathematics, 03.02.2020 15:53 elijahedgar876
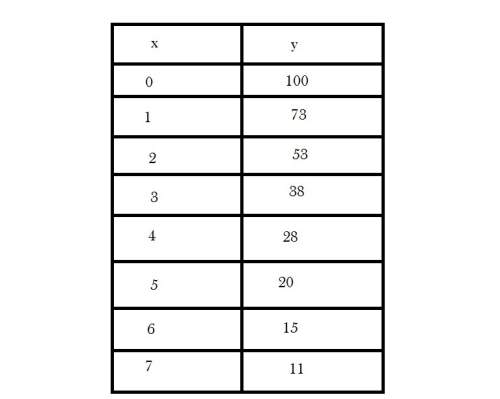
Suppose the data below are the result of a study of a medication used to fight a certain bacteria. the x column represents the number of hours after the medication was introduced to the bacteria and the y column represents the number of bacteria present. use the data in the table below to answer each question.
1. what does the scatterplot of the data show?
a. a strong positive linear relationship
b. a strong negative linear relationship
c. a curve that represents exponential growth
d. a curve that represents exponential decay
2. complete an exponential transformation on the y-values. what is the new value of y when x = 5?
a. 1.301
b. 0.699
c. 1.4472
d. 1.1761
3. find the linear transformation model.
a. log y^ (y-hat) = -12.1667x + 84.8333
b. log y^ (y-hat) = 84.8333x – 12.167
c. log y^ (y-hat) = -0.1375x + 1.9978
d. log y^ (y-hat) = 1.9978x – 0.1375
4. predict the number of bacteria present for 12 hours.
a. 0.35
b. 2.23
c. -61
d. 0

Answers: 3
Another question on Mathematics
Mathematics, 21.06.2019 19:50
Examine the two-step equation. − 7 4 + x 4 = 2 which property of operations allows you to add the same constant term to both sides? amultiplication property of equality bdivision property of equality caddition property of equality dsubtraction property of equality
Answers: 2
Mathematics, 21.06.2019 20:00
Which statement about the annual percentage rate (apr) is not true?
Answers: 3
Mathematics, 21.06.2019 22:50
If set d is not the empty set but is a subset of set e, then which of the following is true? d ∩ e = d d ∩ e = e d ∩ e = ∅
Answers: 1
You know the right answer?
Suppose the data below are the result of a study of a medication used to fight a certain bacteria. t...
Questions


Physics, 22.04.2020 23:01


Mathematics, 22.04.2020 23:01
Mathematics, 22.04.2020 23:01

Arts, 22.04.2020 23:01
Mathematics, 22.04.2020 23:01
Mathematics, 22.04.2020 23:01
Mathematics, 22.04.2020 23:02


