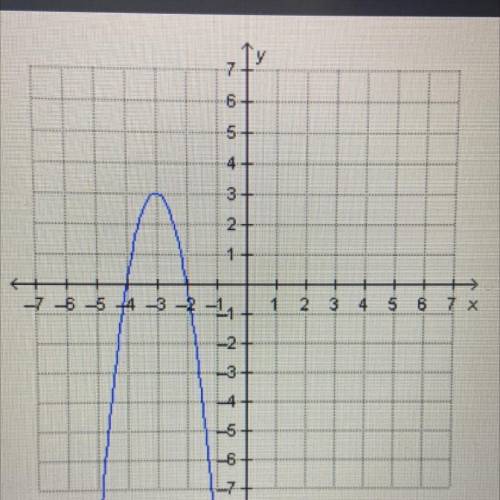
Which quadratic function is represented by the graph?
f(x) = - 1/3( x+ 3)^2 + 3
f(x) = - 1/3(...

Mathematics, 19.04.2021 02:20 valles36
Which quadratic function is represented by the graph?
f(x) = - 1/3( x+ 3)^2 + 3
f(x) = - 1/3(x - 3)^2 + 3
f(x) = -3(x + 3)^2 + 3
f(x) = -3(x - 3)^2 + 3

Answers: 3
Another question on Mathematics
Mathematics, 21.06.2019 15:00
The data shown in the table below represents the weight, in pounds, of a little girl, recorded each year on her birthday. age (in years) weight (in pounds) 2 32 6 47 7 51 4 40 5 43 3 38 8 60 1 23 part a: create a scatter plot to represent the data shown above. sketch the line of best fit. label at least three specific points on the graph that the line passes through. also include the correct labels on the x-axis and y-axis. part b: algebraically write the equation of the best fit line in slope-intercept form. include all of your calculations in your final answer. part c: use the equation for the line of best fit to approximate the weight of the little girl at an age of 14 years old.
Answers: 3
Mathematics, 21.06.2019 17:30
The sales totals at macy's food store have increased exponentially over the months. which of these best shows the sales in the first three months?
Answers: 2
Mathematics, 21.06.2019 19:30
Solve the equation for x.3(6x - 1) = 12 i've tried doing the math and i can't find out what i'm doing wrong
Answers: 1
Mathematics, 21.06.2019 21:00
An account with a $250 balance accrues 2% annually. if no deposits or withdrawals are made, which graph can be used to determine approximately how many years will it take for the balance to be $282? it's e2020 ni️️as
Answers: 1
You know the right answer?
Questions
Mathematics, 19.11.2020 01:00


Mathematics, 19.11.2020 01:00
History, 19.11.2020 01:00


Mathematics, 19.11.2020 01:00


Mathematics, 19.11.2020 01:00


