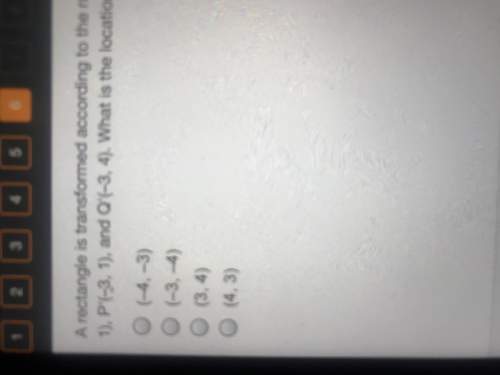
the answer is (4,3)
since the rule for r0, 90º is (-y,x) and it was already applied to form the image, all you have to do is reverse the answer using this formula.
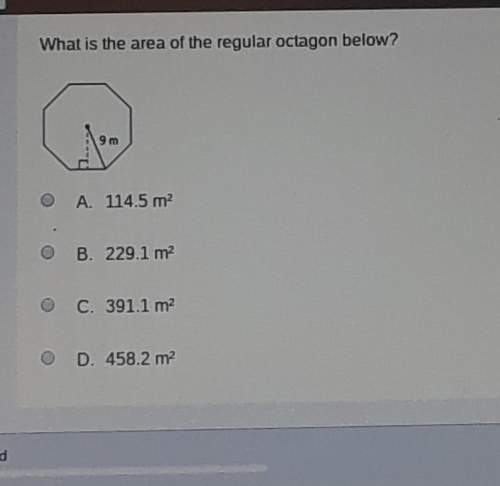
c
step-by-step explanation: