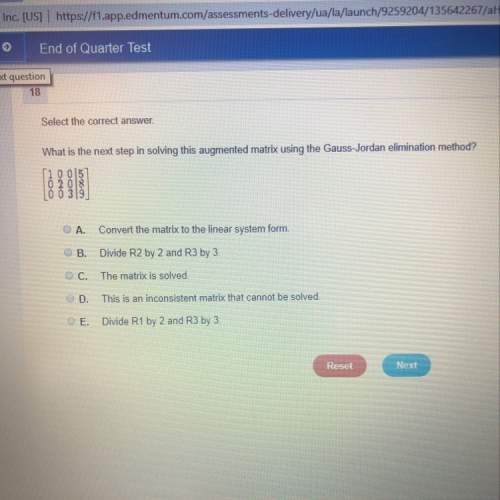
These box plots show daily low temperatures for a sample of days in two
different towns.
Town...

Mathematics, 13.04.2021 03:00 joho38
These box plots show daily low temperatures for a sample of days in two
different towns.
Town A
15 20
30
40
45
Town B
2
35
40 45 48
0
5
10
15
20
45
60
50
55
25 30 35 40
Degrees (F)
Compare the shapes of the box plots.
A. Both distributions are negatively skewed.
B. The distribution for town A is symmetric, but the distribution for
town B is negatively skewed.
C. Both distributions are symmetric.
D. The distribution for town A is symmetric, but the distribution for
town B is positively skewed.

Answers: 1
Another question on Mathematics
Mathematics, 21.06.2019 23:00
Joey is asked to name a quadrilateral that is also a rhombus and has 2 pairs of parallel sides.should be his answer
Answers: 1
Mathematics, 22.06.2019 05:40
Joe owns a fast-food restaurant and wants to know the average time it takes for customers to receive their orders. his restaurant serves about 500 customers a day. he timed 5 orders, and the order times he collected, given in minutes, are shown below. can the approximate order fulfillment time for all of the restaurant's customers be calculated from the given data? if so, calculate it. non-integer answers should be rounded to the nearest tenth. if no assumption can be made, type "0" in the box. the approximate order fulfillment time for all of the restaurant's customers is minutes.
Answers: 3
You know the right answer?
Questions


Social Studies, 04.12.2020 17:20


Mathematics, 04.12.2020 17:20

Business, 04.12.2020 17:20

Biology, 04.12.2020 17:20
English, 04.12.2020 17:20
Social Studies, 04.12.2020 17:20
History, 04.12.2020 17:20


