
Mathematics, 10.04.2021 15:00 arthurdolz
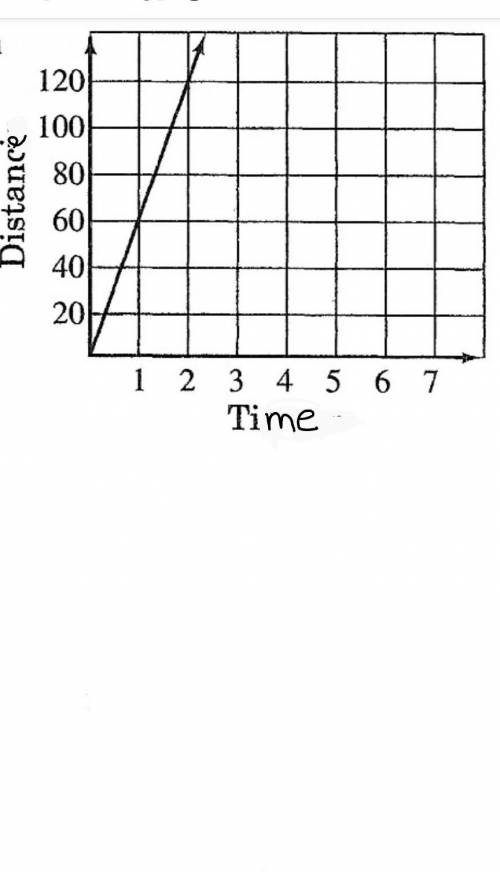
The graph to the right shows the relationship between distance and time for a car that is similar to constant speed.
1) What is the velocity ?_
2) Is it a function _
3) If it is a function, write the rule to represent it _
4.) Make a table for the function, and indicate 6 pairs of inputs / outputs.

Answers: 3
Another question on Mathematics
Mathematics, 21.06.2019 20:00
Someone answer asap for ! max recorded the heights of 500 male humans. he found that the heights were normally distributed around a mean of 177 centimeters. which statements about max’s data must be true? a. the median of max’s data is 250 b. more than half of the data points max recorded were 177 centimeters. c. a data point chosen at random is as likely to be above the mean as it is to be below the mean. d. every height within three standard deviations of the mean is equally likely to be chosen if a data point is selected at random.
Answers: 1
Mathematics, 21.06.2019 21:50
Scores on a university exam are normally distributed with a mean of 78 and a standard deviation of 8. the professor teaching the class declares that a score of 70 or higher is required for a grade of at least “c.” using the 68-95-99.7 rule, what percentage of students failed to earn a grade of at least “c”?
Answers: 1
Mathematics, 21.06.2019 23:10
Which graph represents the linear function below? y-4= (4/3)(x-2)
Answers: 2
You know the right answer?
The graph to the right shows the relationship between distance and time for a car that is similar to...
Questions
Mathematics, 23.04.2020 11:27

Mathematics, 23.04.2020 11:28

Chemistry, 23.04.2020 11:28
Mathematics, 23.04.2020 11:28
Mathematics, 23.04.2020 11:29


English, 23.04.2020 11:29
English, 23.04.2020 11:29

Medicine, 23.04.2020 11:29
English, 23.04.2020 11:29

Business, 23.04.2020 11:31


