
Mathematics, 08.04.2021 20:20 Pomskis2341
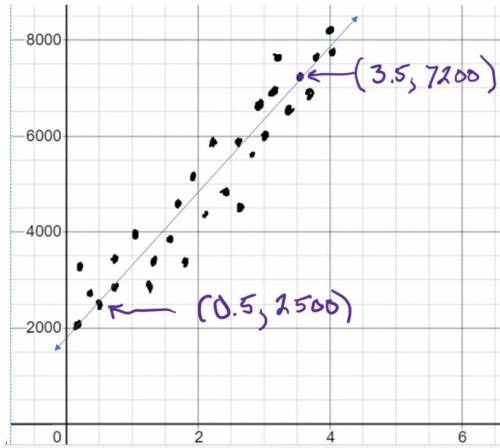
Since Spring started, Kareem has been surveying the growth of leaves on his neighborhood trees. He goes out every day and computes the average number of leaves on a sample of trees. He created a scatter plot where the y-axis represents the average number of leaves on the trees, and the x-axis represents the number of weeks since Spring started. Write a linear equation in slope-intercept form that can be used to approximate the data distribution using the two data points labeled on the best fit line.

Answers: 1
Another question on Mathematics
Mathematics, 21.06.2019 16:10
The box plot shows the number of raisins found in sample boxes from brand c and from brand d. each box weighs the same. what could you infer by comparing the range of the data for each brand? a) a box of raisins from either brand has about 28 raisins. b) the number of raisins in boxes from brand c varies more than boxes from brand d. c) the number of raisins in boxes from brand d varies more than boxes from brand c. d) the number of raisins in boxes from either brand varies about the same.
Answers: 2
Mathematics, 22.06.2019 00:40
Calculate the annual effective interest rate of a 12 % nominal annual interest rate compound monthly
Answers: 1
Mathematics, 22.06.2019 01:50
Quadrilateral ghij has coordinates g(5, 1), h(4, -3), i(6, -1), and j(2, 1). if the quadrilateral is reflected over the line y = x, what are the coordinates of h'?
Answers: 1
Mathematics, 22.06.2019 03:00
Atest of sobriety involves measuring the subject's motor skills. a sample of 31 randomly selected sober subjects take the test and produce a mean score of 64.4 with a standard deviation of 2. a claim is made that the true mean score for all sober subjects is equal to 65. for each part below, enter only a numeric value in the answer box. for example, do not type "z =" or "t =" before your answers. round each of your answers to 3 places after the decimal point. (a) calculate the value of the test statistic used in this test. test statistic's value = (b) use your calculator to find the p-value of this test. p-value = (c) use your calculator to find the critical value(s) used to test this claim at the 0.2 significance level. if there are two critical values, then list them both with a comma between them. critical value(s) =
Answers: 2
You know the right answer?
Since Spring started, Kareem has been surveying the growth of leaves on his neighborhood trees. He g...
Questions


History, 02.09.2019 12:50


English, 02.09.2019 12:50
Mathematics, 02.09.2019 12:50
Mathematics, 02.09.2019 12:50
English, 02.09.2019 13:00

Physics, 02.09.2019 13:00
History, 02.09.2019 13:00
History, 02.09.2019 13:00
English, 02.09.2019 13:00


